Fig. 5.
Download original image
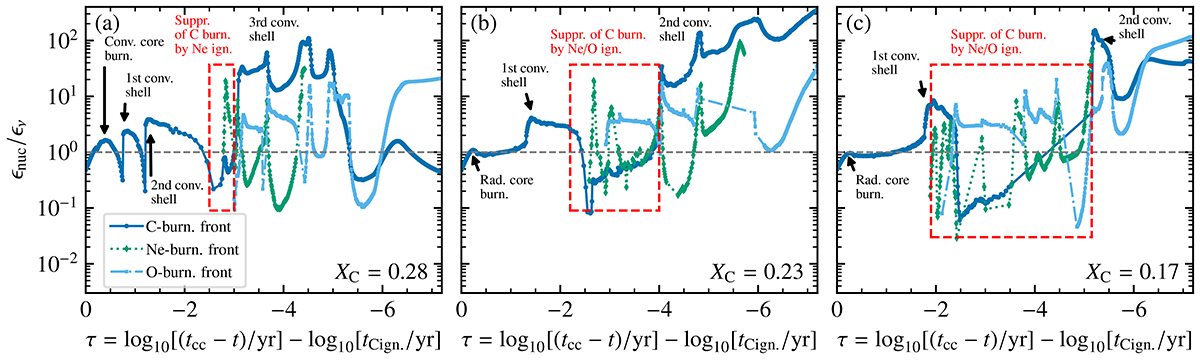
Time evolution of the ratio between the specific nuclear energy generation rate ϵnuc and the neutrino loss rate ϵν at the location of the C, Ne, and O-burning fronts for models with the same core mass and different central carbon abundances. The dashed horizontal line indicates where ϵnuc = ϵν. When the energy ratio significantly exceeds this line, convection occurs (Sukhbold & Adams 2020). With a decreasing core carbon abundance, the core becomes more neutrino dominated and neon burning, followed by oxygen burning, occur earlier. As highlighted in the red boxes, this temporarily suppresses carbon burning.
Current usage metrics show cumulative count of Article Views (full-text article views including HTML views, PDF and ePub downloads, according to the available data) and Abstracts Views on Vision4Press platform.
Data correspond to usage on the plateform after 2015. The current usage metrics is available 48-96 hours after online publication and is updated daily on week days.
Initial download of the metrics may take a while.