Fig. 4.
Download original image
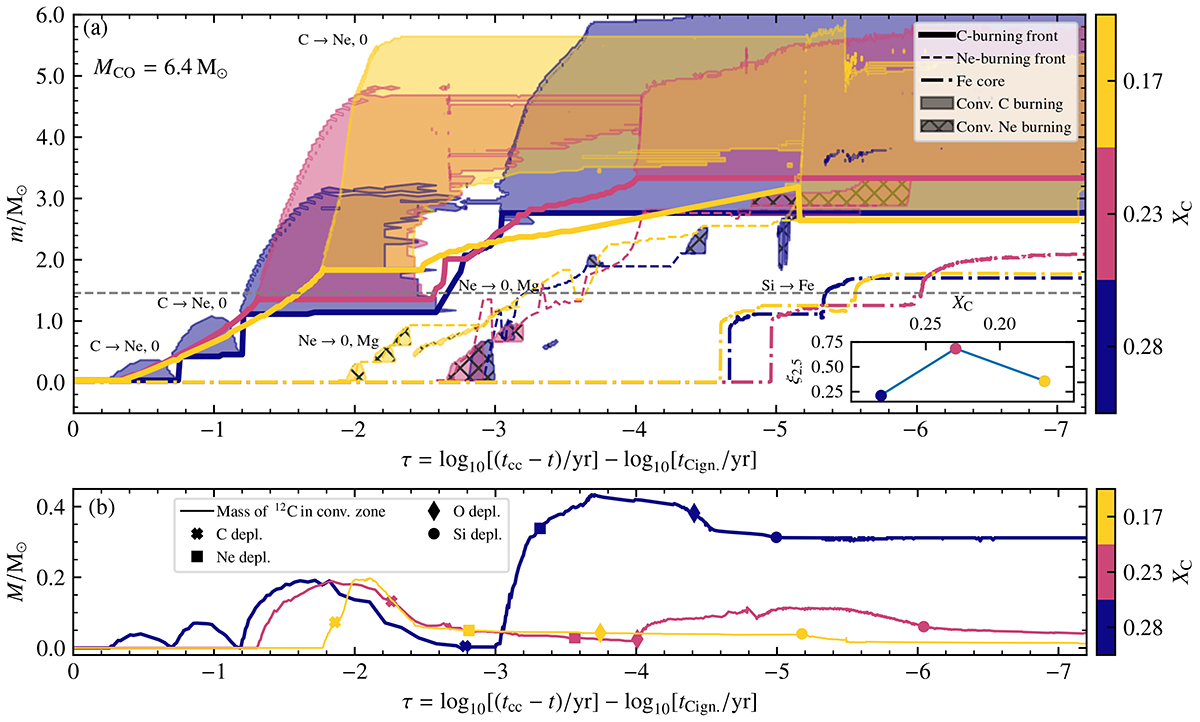
Evolution of key elements of the inner 6 M⊙ core structure as a function of time from carbon ignition to core collapse for models with the same core mass and a different central carbon abundances XC. (a) Kippenhahn diagram with selected elements. Full and dashed lines indicate the carbon and neon-burning fronts, respectively. Shaded (hatched) regions show convective carbon (neon) burning regions in the core. The iron-core masses are indicated with dash-dotted lines. The gray horizontal dashed line indicates the classical Chandrasekhar limit. The inset figure shows the final compactness of these models as a function of decreasing XC. (b) Total mass of 12C in the convective carbon-burning shells for each of the models as a function of time.
Current usage metrics show cumulative count of Article Views (full-text article views including HTML views, PDF and ePub downloads, according to the available data) and Abstracts Views on Vision4Press platform.
Data correspond to usage on the plateform after 2015. The current usage metrics is available 48-96 hours after online publication and is updated daily on week days.
Initial download of the metrics may take a while.