Fig. 15.
Download original image
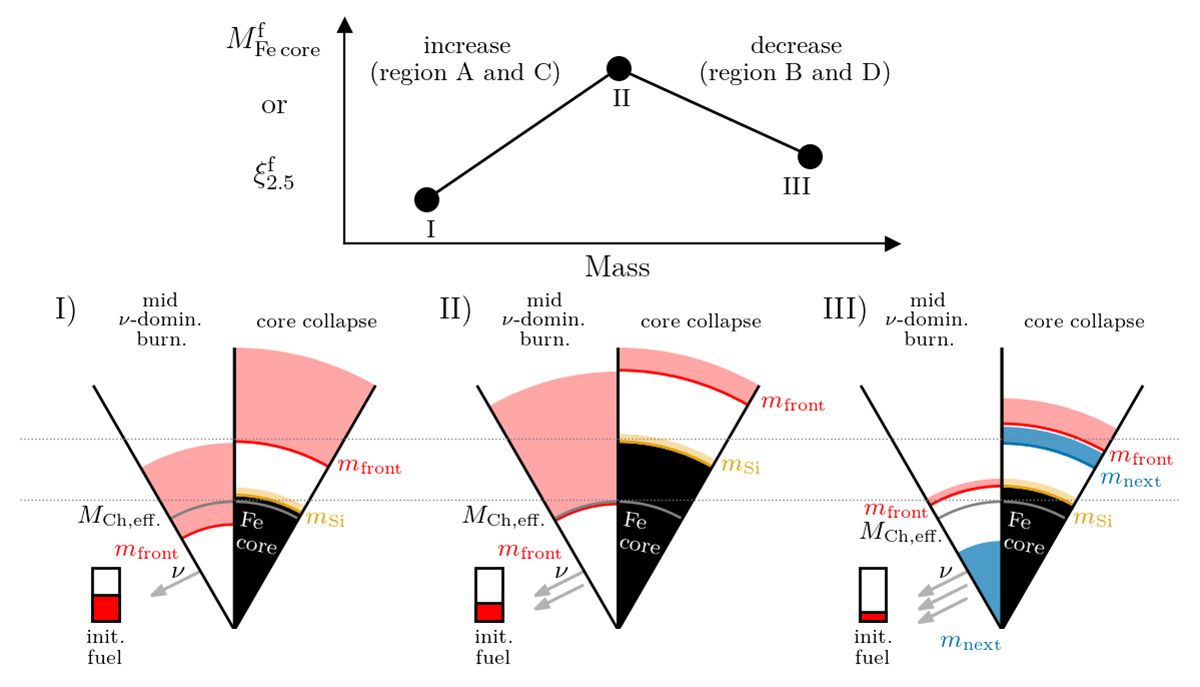
Schematic representation of the mechanisms leading to the emergence and decline of peaks in final iron core mass and compactness. Horizontal gray dotted guidelines are included to aid the comparison. Star I – Before peak: Schematic stellar structures of a star with a low final iron core mass at two points in the evolution represented by two adjacent wedges. The initial mass fraction of the fuel is still high (see red area in the rectangle) but the main burning stage is neutrino-dominated (arrows). Because neutrinos take away energy, the core contracts and the burning front (red line) moves out in mass as the burning progresses. The large amount of fuel prevents it from moving far out before a convective zone forms above the burning front once the energy generated is high (shaded red area). Ultimately (right wedge), it grows a small fuel-free core and the silicon-burning front (yellow line) cannot move far out in mass, forming a small iron core (black area). Star II – Peak: With a higher mass and lower initial fuel mass fraction, the burning is even more neutrino dominated and a strong contraction occurs. Hence the burning front moves further out in mass than in I, but stays just below the effective Chandrasekhar mass. Aided by degeneracy pressure support, the star burns through almost all available fuel before the next burning stage ignites, after which it quickly moves out in mass, growing a large fuel-free core and eventually a large iron core. Star III – Beyond peak: For an even lower initial fuel abundance and higher mass, the burning is even more neutrino dominated and the core contraction accelerates. The burning front moves further out and exceeds the effective Chandrasekhar mass. This triggers a fast contraction of the partially degenerate core and the next burning stage (blue area) ignites early. This next stage suppresses nuclear burning at the front above. As a result, the burning front moves out in mass slowly and eventually (right wedge) the star grows a low-mass iron core.
Current usage metrics show cumulative count of Article Views (full-text article views including HTML views, PDF and ePub downloads, according to the available data) and Abstracts Views on Vision4Press platform.
Data correspond to usage on the plateform after 2015. The current usage metrics is available 48-96 hours after online publication and is updated daily on week days.
Initial download of the metrics may take a while.