Fig. 1.
Download original image
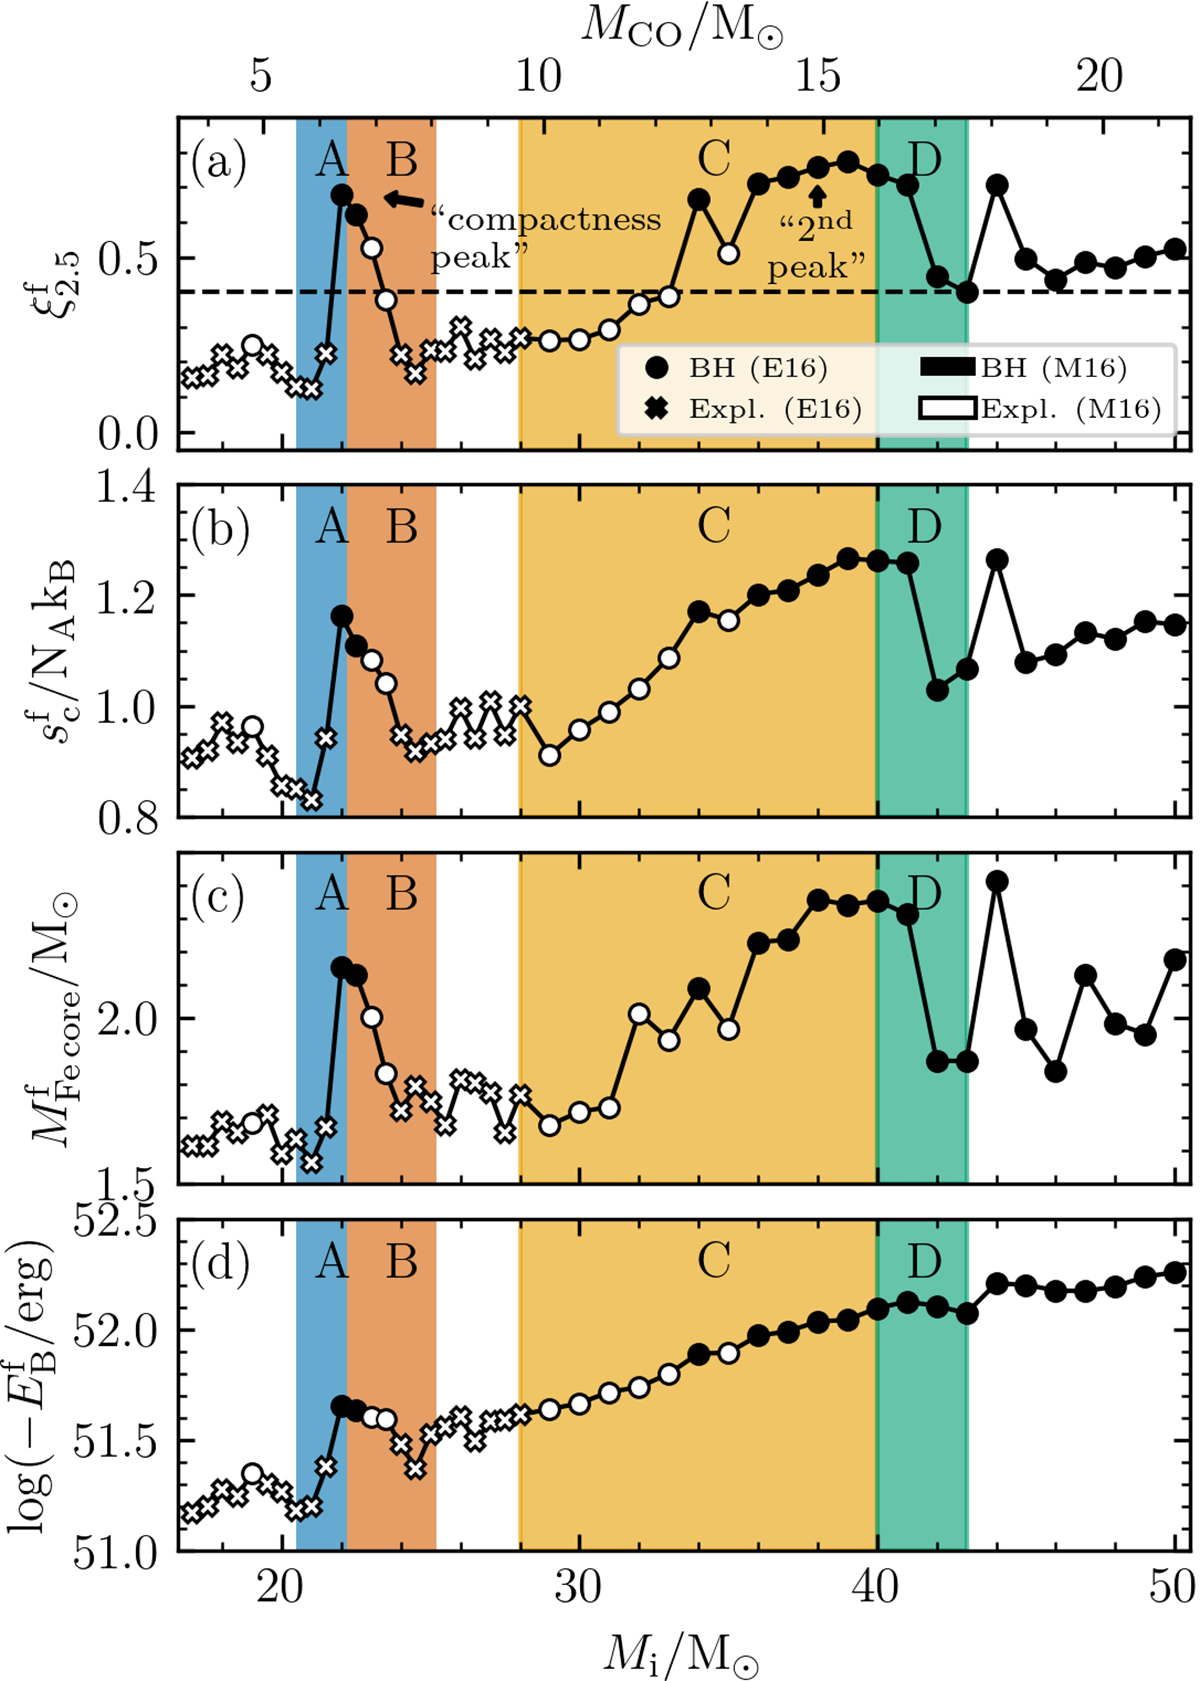
Final (a) compactness, (b) specific central entropy, (c) iron core mass, and (d) binding energy above M4 at the onset of core collapse as a function of the initial mass. The top axis shows the CO core mass at core helium exhaustion. Circles and crosses represent BH formation and explosions, respectively, according to the Ertl et al. (2016) criterion, while black and white colors indicate BH formation and explosions based on the Müller et al. (2016) SN model.
Current usage metrics show cumulative count of Article Views (full-text article views including HTML views, PDF and ePub downloads, according to the available data) and Abstracts Views on Vision4Press platform.
Data correspond to usage on the plateform after 2015. The current usage metrics is available 48-96 hours after online publication and is updated daily on week days.
Initial download of the metrics may take a while.