Open Access
Fig. 5.
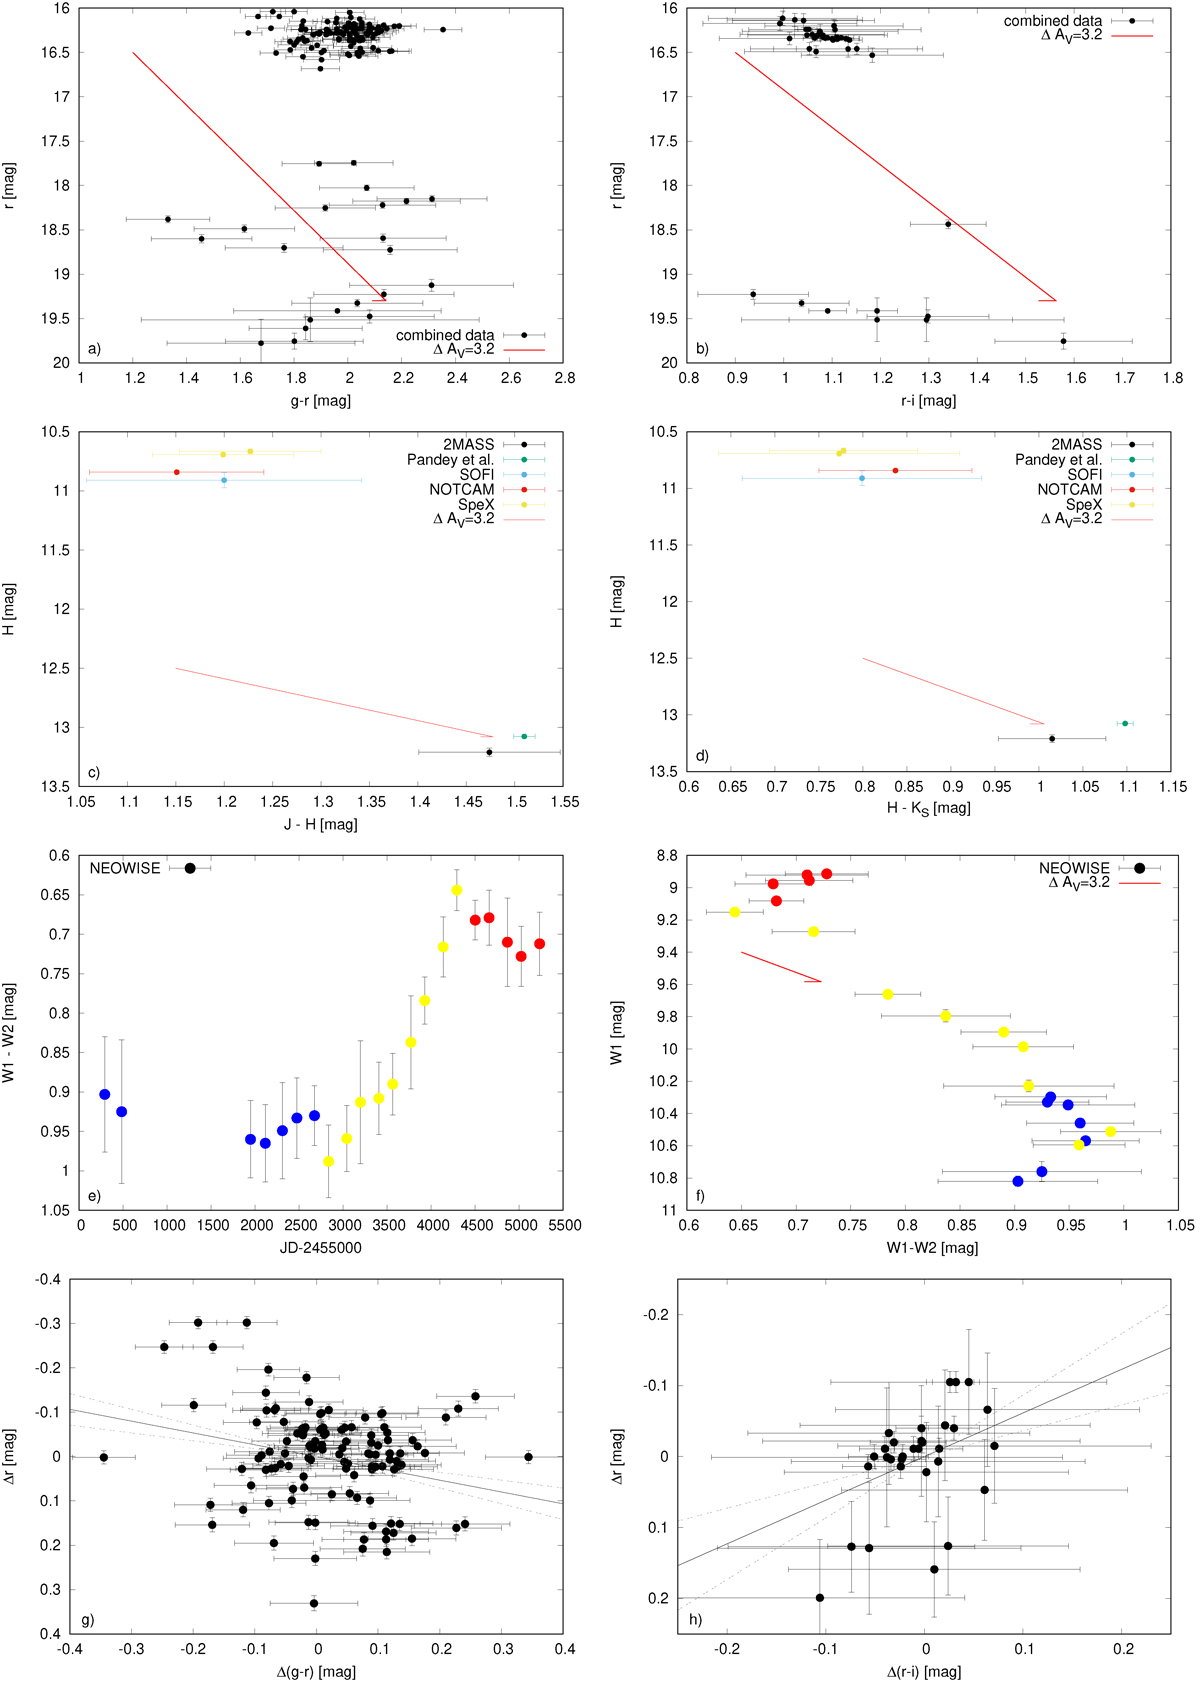
Download original image
CMDs in the optical and IR part of the spectrum. The (NEO)WISE data are colour-coded: blue represents the quiescence, yellow: the rising branch and red: the plateau. The bottom line shows two diagrams computed from the detrended ZTF and RC80 gri data taken during the plateau only.
Current usage metrics show cumulative count of Article Views (full-text article views including HTML views, PDF and ePub downloads, according to the available data) and Abstracts Views on Vision4Press platform.
Data correspond to usage on the plateform after 2015. The current usage metrics is available 48-96 hours after online publication and is updated daily on week days.
Initial download of the metrics may take a while.