Fig. 4
Download original image
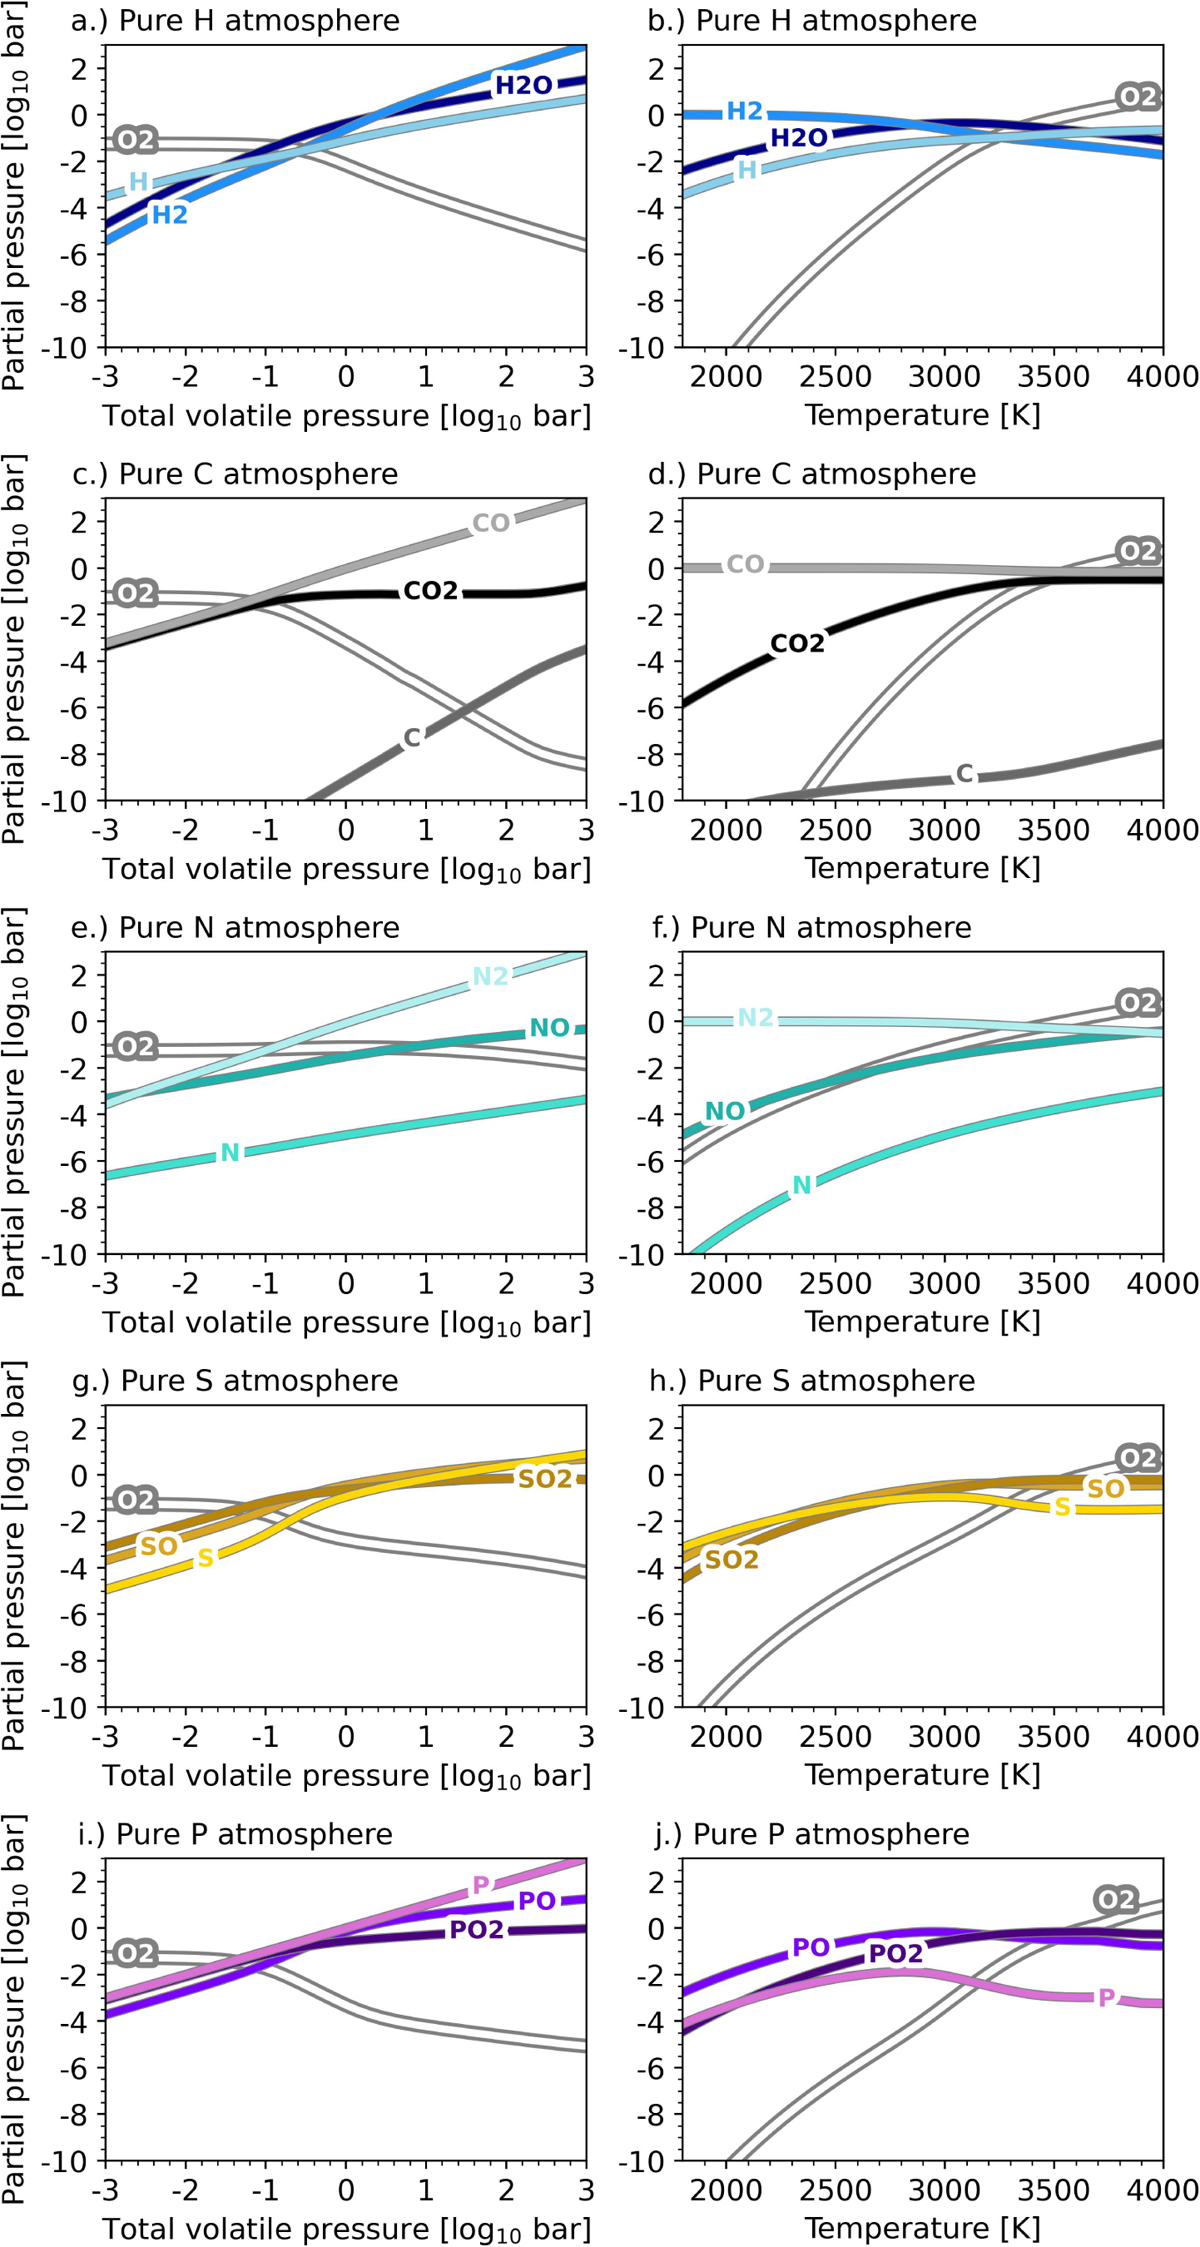
Behaviour of major volatile species in pure volatile atmospheres: For each of the tested pure volatile atmospheres, we show the behaviour of the major volatile species. The plots in the left column show partial pressures as a function of total volatile pressure at a fixed temperature of 3000 K. The plots in the right column show partial pressures as a function of temperature at a fixed total volatile pressure of 1 bar.
Current usage metrics show cumulative count of Article Views (full-text article views including HTML views, PDF and ePub downloads, according to the available data) and Abstracts Views on Vision4Press platform.
Data correspond to usage on the plateform after 2015. The current usage metrics is available 48-96 hours after online publication and is updated daily on week days.
Initial download of the metrics may take a while.