Fig. 3
Download original image
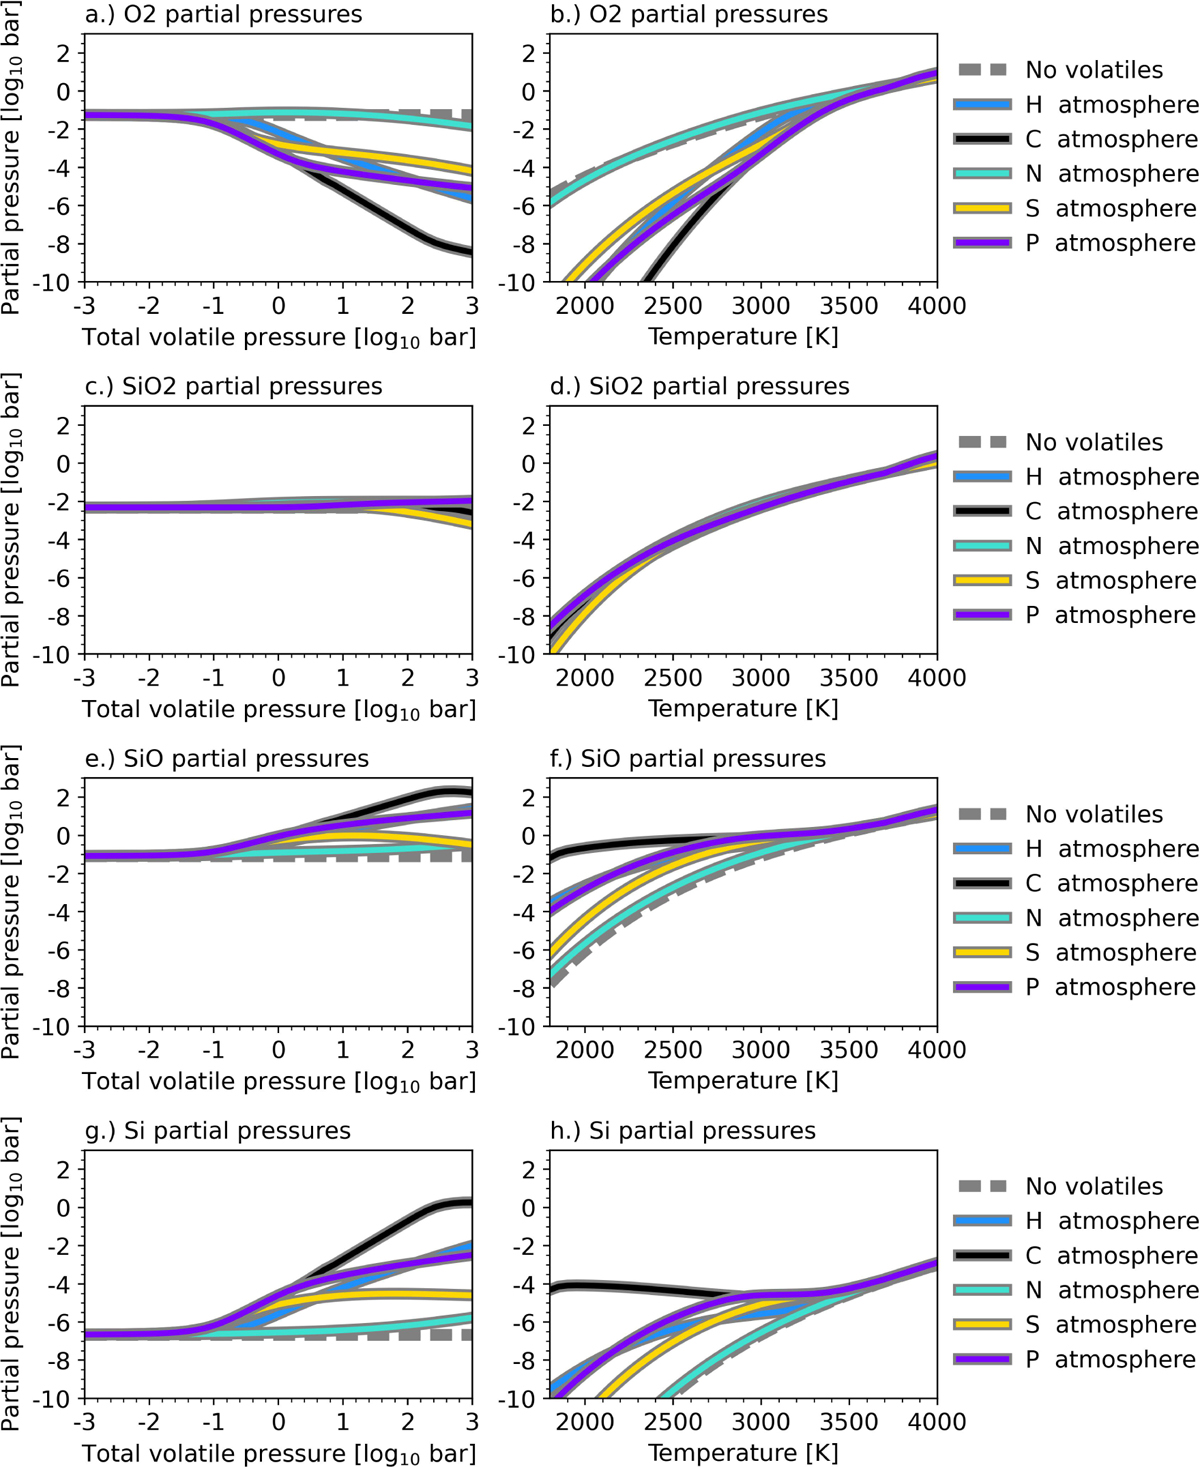
Effect of pure volatile atmospheres on Si species: Shown here are the partial pressures of SiO2 (top row, panels a and b), SiO (middle row, panels c and d), and Si (bottom row, panels e and f) above a BSE lava ocean. The plots in the left column show partial pressures as a function of total volatile pressure at a fixed temperature of 3000 K. The plots in the right column show partial pressures as a function of temperature at a fixed total volatile pressure of 1 bar. The partial pressures of vaporised species in an atmosphere without volatiles (grey dashed line), pure H atmosphere (dark blue), pure C atmosphere (black), pure N atmosphere (light blue), pure S atmosphere (yellow), and pure P atmosphere (light purple) above a BSE lava ocean are shown for comparison.
Current usage metrics show cumulative count of Article Views (full-text article views including HTML views, PDF and ePub downloads, according to the available data) and Abstracts Views on Vision4Press platform.
Data correspond to usage on the plateform after 2015. The current usage metrics is available 48-96 hours after online publication and is updated daily on week days.
Initial download of the metrics may take a while.