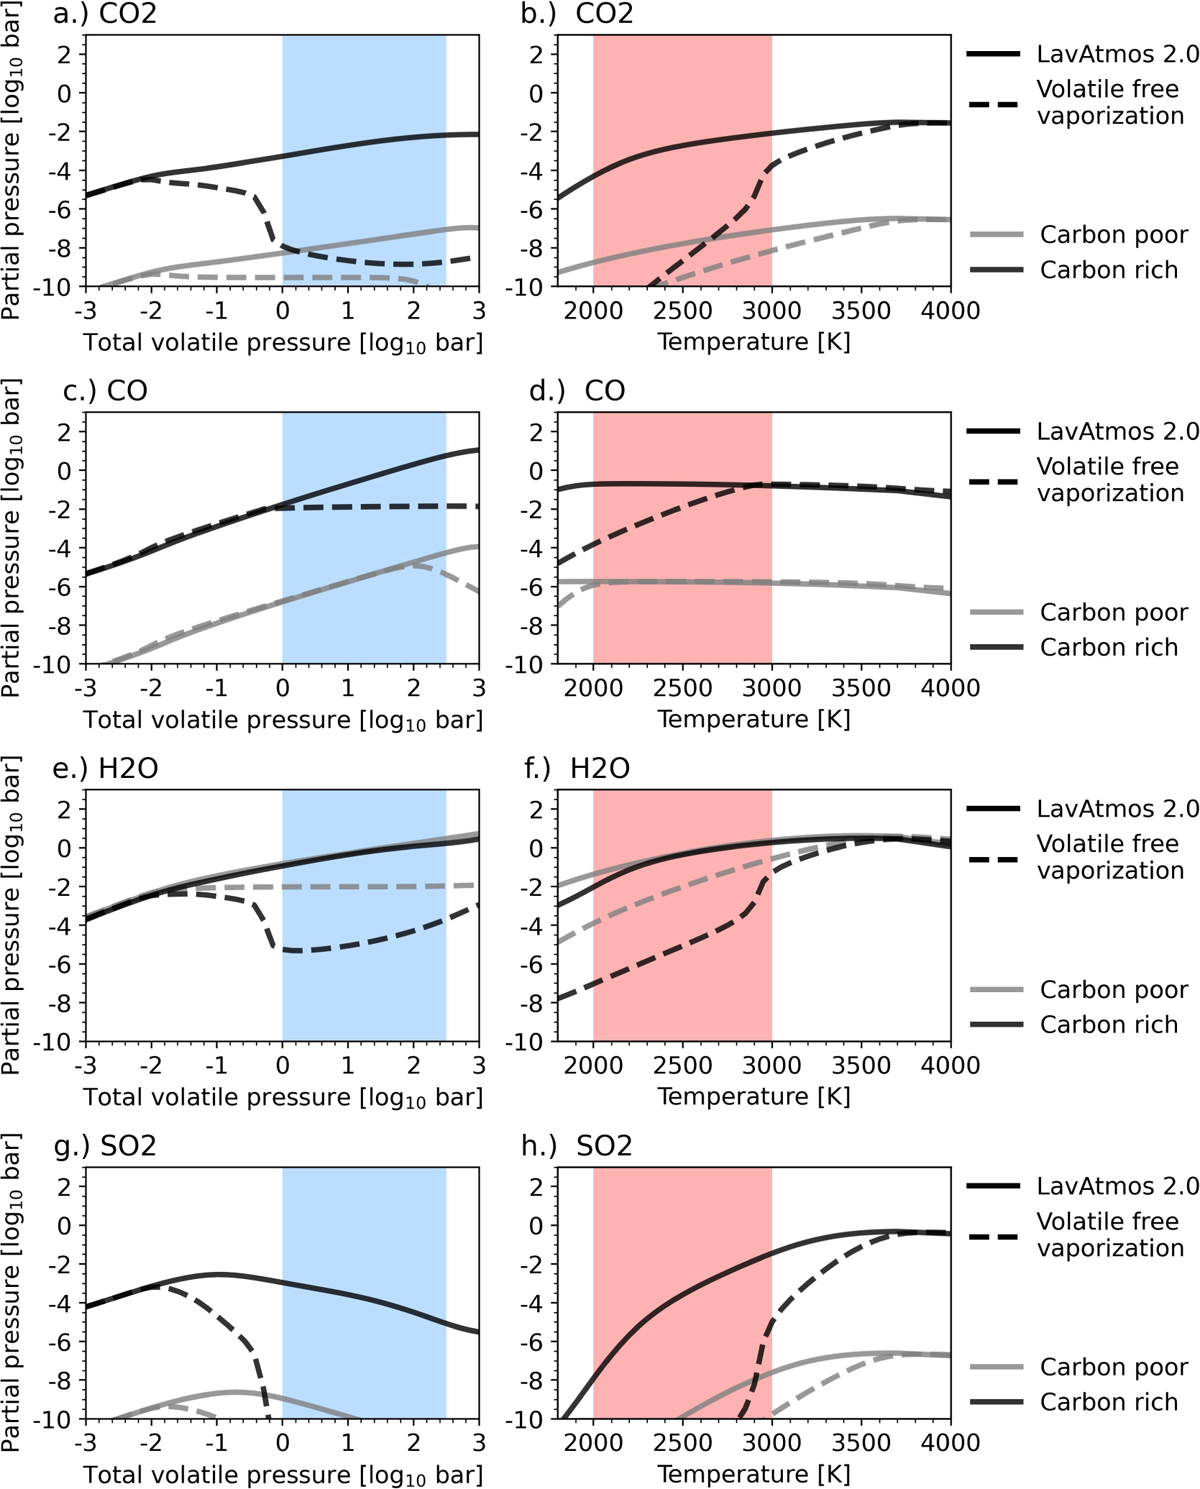
Fig. 10
Download original image
Computed partial pressures of volatile species in a 55-Cnc e like atmosphere: shown here are the partial pressures of CO (panels a and b) CO2 (panels c and d), H2O (panels e and f), SO2 (panels ɡ and h). The solid lines indicate the partial pressures calculated using LavAtmos 2.0 (this study) and the dashed lines show the partial pressures calculated when using the volatile-free vaporisation approach. Two volatile atmosphere compositions are tested (see Table 1) of which one is carbon poor (≃0.01 w% C, grey) and the other carbon rich (≃10%, black). The left-hand panel shows partial pressures plotted as a function of the total volatile pressure of the atmosphere at a fixed temperature of 2500, and the right-hand panel as a function of surface temperature at a fixed total volatile pressure of 10 bar. The blue area indicates the estimated surface pressure range of 55-Cnc e and the red area indicates the estimated surface temperature range of 55-Cnc e (Hu et al. 2024).
Current usage metrics show cumulative count of Article Views (full-text article views including HTML views, PDF and ePub downloads, according to the available data) and Abstracts Views on Vision4Press platform.
Data correspond to usage on the plateform after 2015. The current usage metrics is available 48-96 hours after online publication and is updated daily on week days.
Initial download of the metrics may take a while.