Fig. 9
Download original image
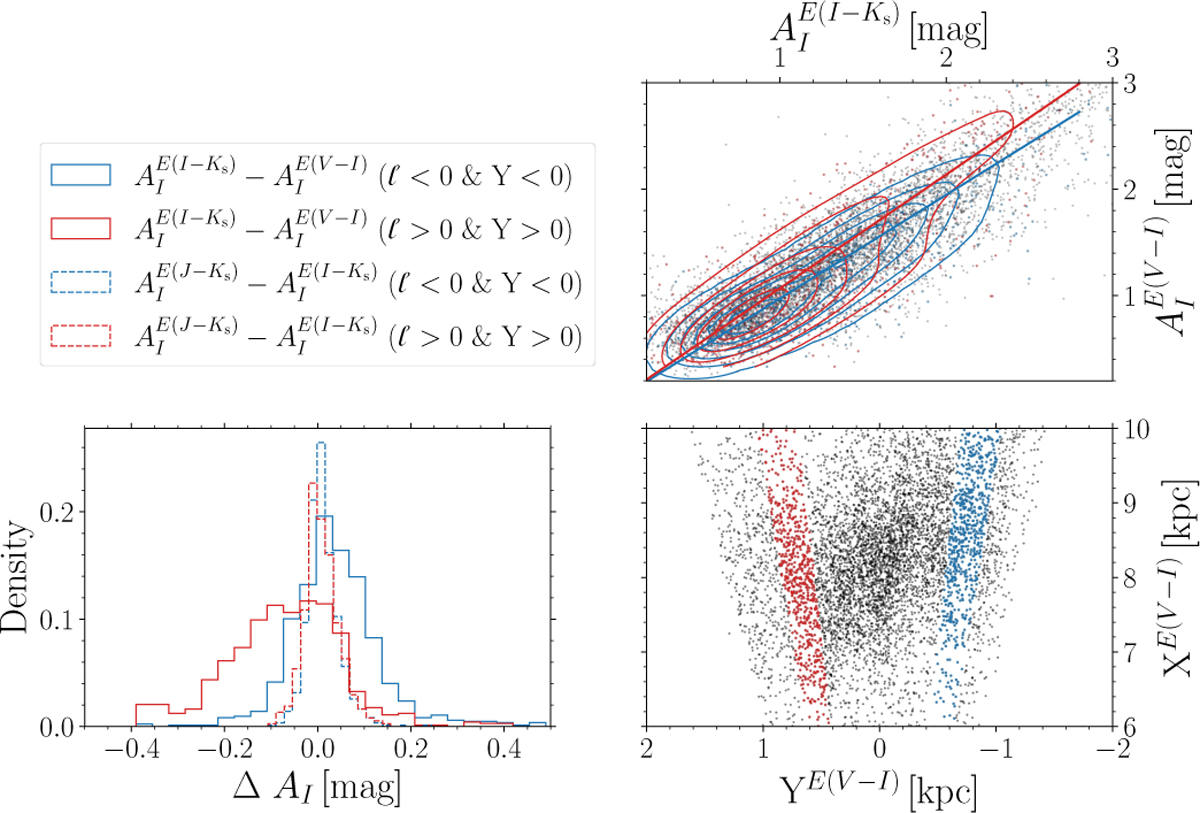
Comparison of AI extinction estimates in two Galactic longitude bins. The red lines and points represent the bin at positive Galactic longitudes, while the blue points and lines represent stars at negative Galactic longitudes. The dashed lines in the histogram represent the difference in AI for near-IR-based color-excesses, while solid lines show the difference for mainly visual passband-based color-excesses.
Current usage metrics show cumulative count of Article Views (full-text article views including HTML views, PDF and ePub downloads, according to the available data) and Abstracts Views on Vision4Press platform.
Data correspond to usage on the plateform after 2015. The current usage metrics is available 48-96 hours after online publication and is updated daily on week days.
Initial download of the metrics may take a while.