Fig. 8
Download original image
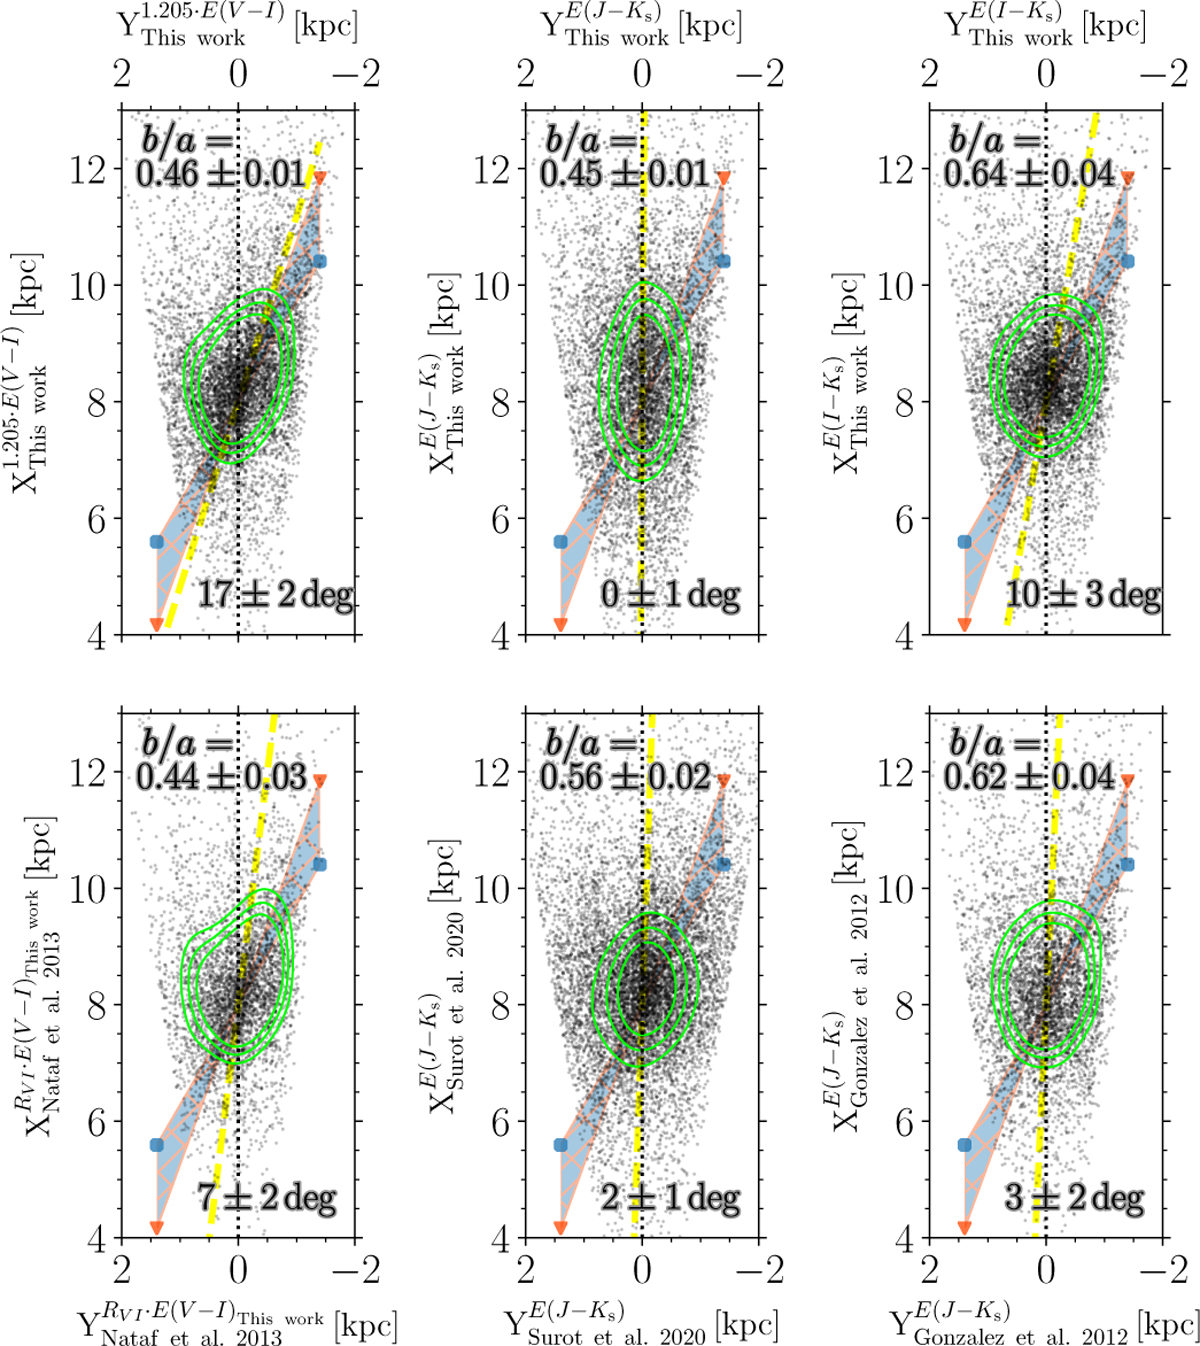
Similar to Fig. 7, we depict spatial distribution bulge RR Lyrae variables using absolute and mean intensity magnitudes (in I band) together with different methods to account for extinction toward the Galactic bulge. The top three panels show spatial distributions derived using color excesses calculated in this work. The bottom two panels show the same spatial distributions but for distances estimated using literature reddening maps toward the Galactic bulge (from left to right, Nataf et al. 2013; Surot et al. 2020; Gonzalez et al. 2012). To measure individual bar angles we binned spatial dataset into eleven bins between ℓ ≥ −5 and ℓ ≤ 5 deg). As in Fig. 6 we depict measured and zero angles with dashed yellow and dotted black lines, respectively. The χ2 for each fit from top left to bottom right are 0.39, 3.4, 0.37, 1.6, 1.4, and 0.43.
Current usage metrics show cumulative count of Article Views (full-text article views including HTML views, PDF and ePub downloads, according to the available data) and Abstracts Views on Vision4Press platform.
Data correspond to usage on the plateform after 2015. The current usage metrics is available 48-96 hours after online publication and is updated daily on week days.
Initial download of the metrics may take a while.