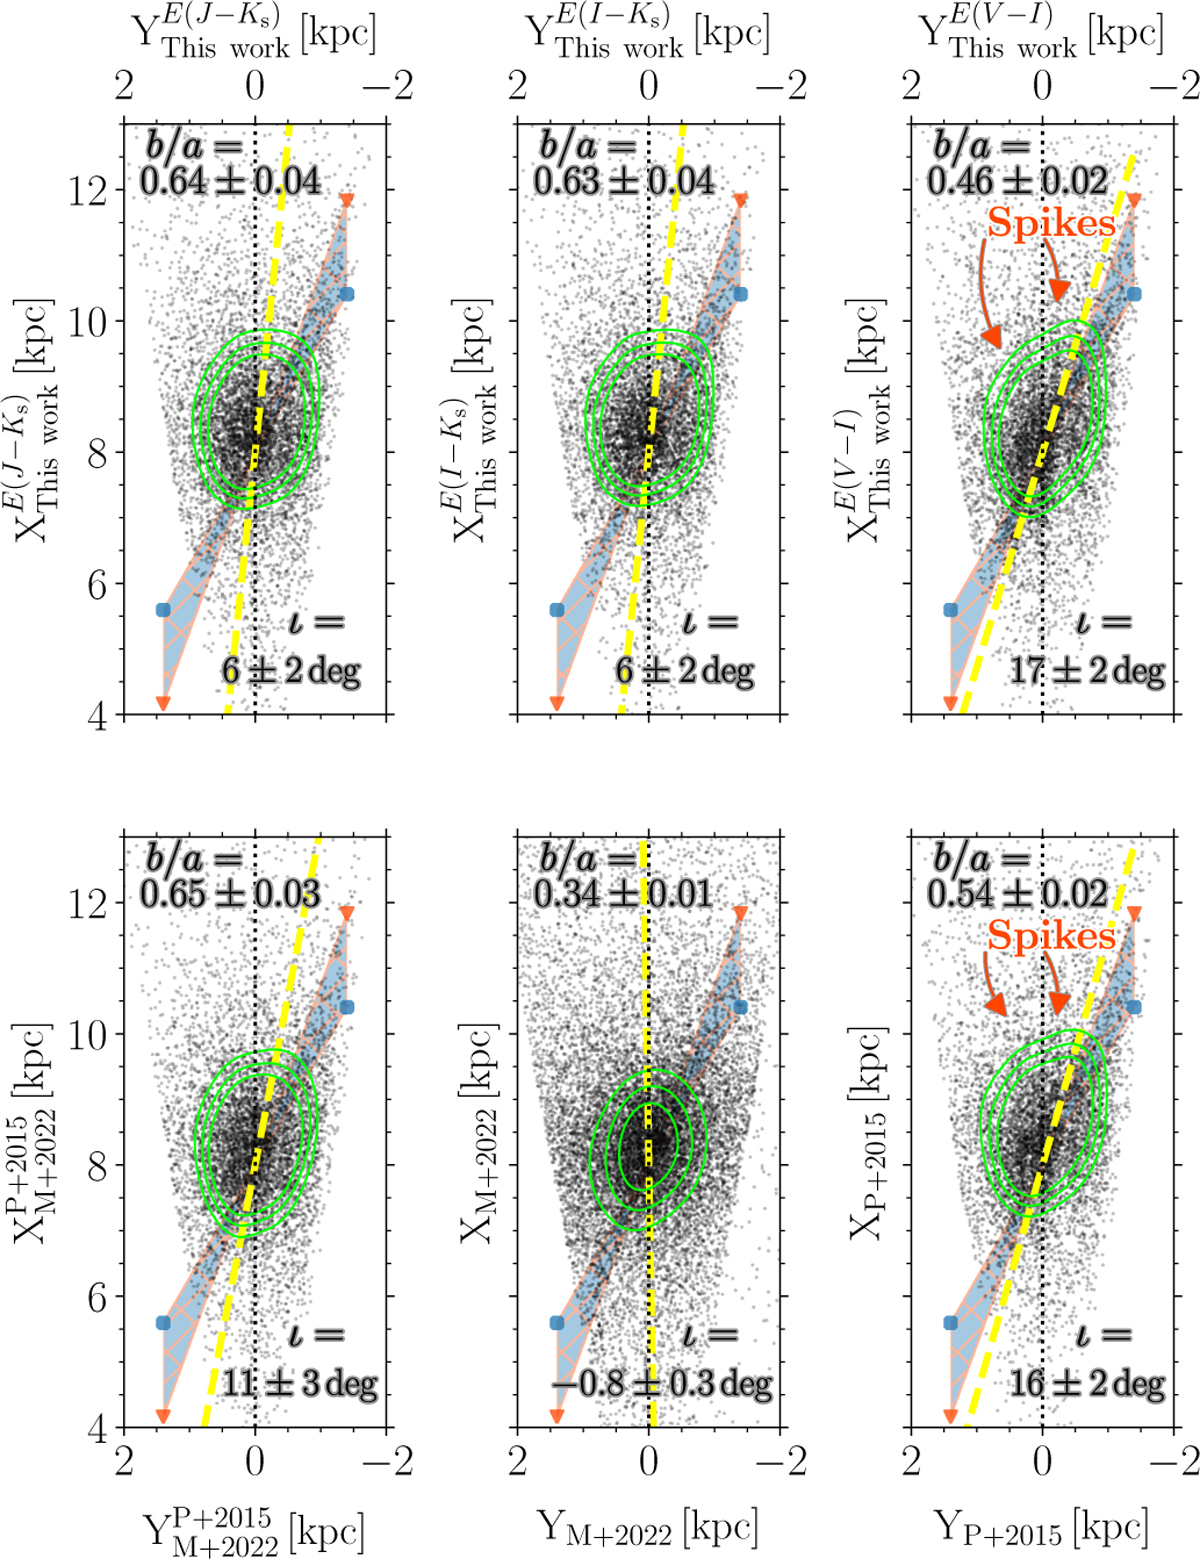
Fig. 7
Download original image
Spatial distribution of RR Lyrae pulsators used for comparison in the Cartesian space. Individual subplots display different distance estimates based on near-IR (left column), a combination of near-IR and visual, and only visual reddening. The top panels show Cartesian coordinates derived based on distances estimated in this study. The bottom panels display the distances derived based on procedures from Pietrukowicz et al. (2015) (P+2015, bottom right panel) and Molnar et al. (2022) (M+2022, middle and bottom left panel). We also show two tentative bar angles with red triangles (20 degrees) and blue circles (30 degrees) and a shaded region marks the angles in between. Note that the Sun is at X = 0 and Y = 0 kpc. As is depicted in Fig. 6, the measured and zero angles are marked with dashed yellow and dotted black lines. Lastly, the χ2 of each fit from top left to bottom right are: 0.56, 0.57, 0.35, 0.51, 15, and 0.39.
Current usage metrics show cumulative count of Article Views (full-text article views including HTML views, PDF and ePub downloads, according to the available data) and Abstracts Views on Vision4Press platform.
Data correspond to usage on the plateform after 2015. The current usage metrics is available 48-96 hours after online publication and is updated daily on week days.
Initial download of the metrics may take a while.