Fig. 5
Download original image
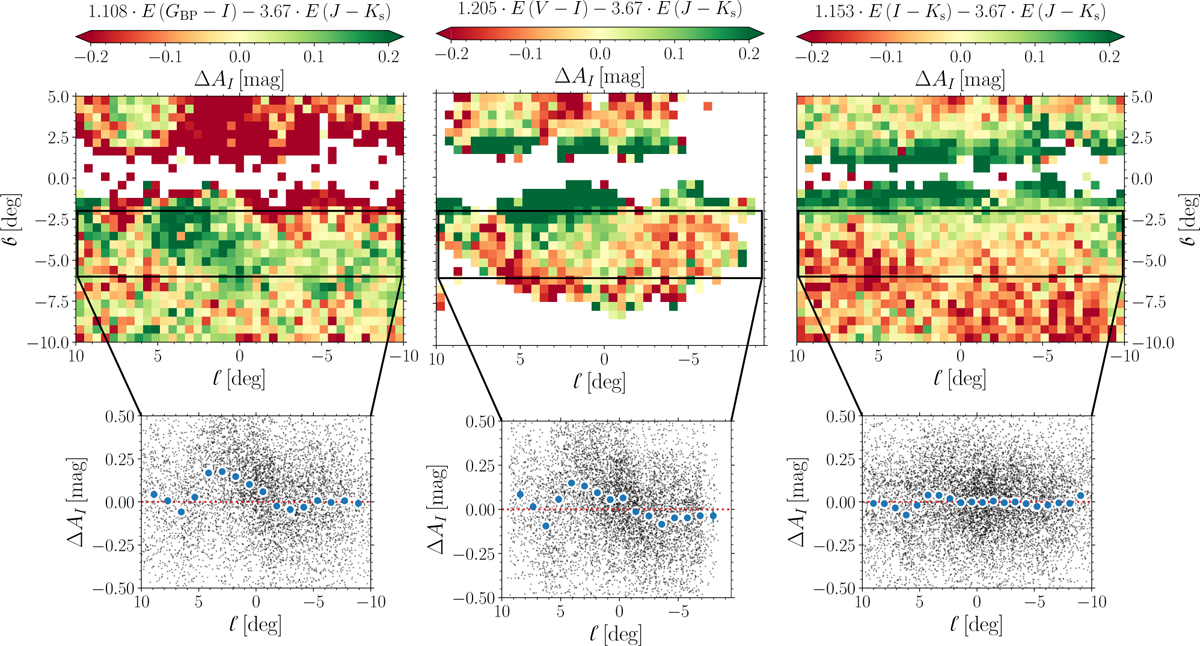
Binned spatial distribution (step equal to 0.5 deg) of differences in estimated extinction ∆AI. Each panel depicts the differences between the extinction (AI) estimated from purely optical or near IR-optical color excesses (E (GBP – I), E (V – I) and E (I – Ks)), and the extinction estimated from the E (J – Ks) color excess. The insets focus on an area below the Galactic plane where we binned (blue circles, seventeen steps between −9.5 to 9.5 deg) the ∆AI as a function of ℓ with gray dots representing individual RR Lyrae stars.
Current usage metrics show cumulative count of Article Views (full-text article views including HTML views, PDF and ePub downloads, according to the available data) and Abstracts Views on Vision4Press platform.
Data correspond to usage on the plateform after 2015. The current usage metrics is available 48-96 hours after online publication and is updated daily on week days.
Initial download of the metrics may take a while.