Fig. D.9
Download original image
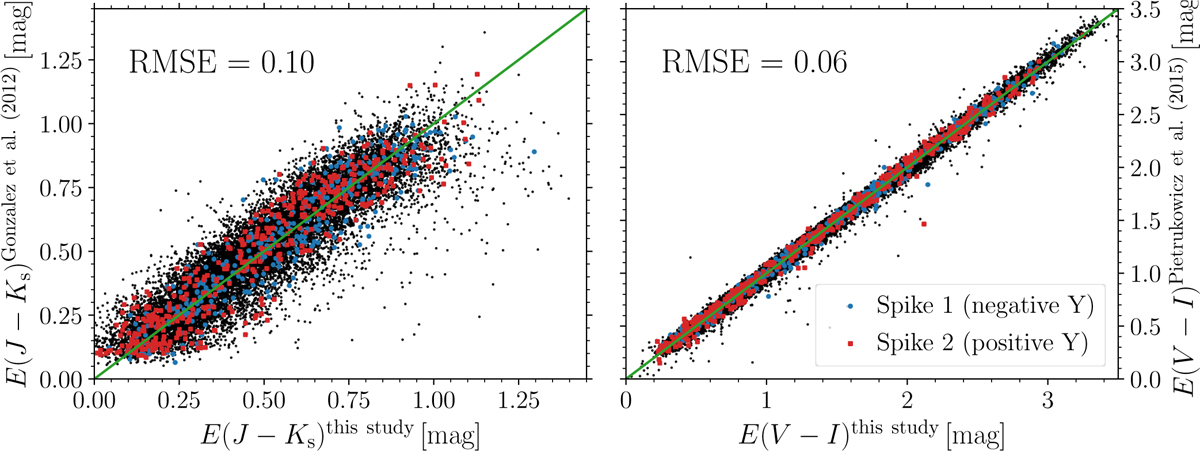
Comparison of reddening E(J − Ks) (left panel) and E(V − I) (right panel) determined in this study and E(J − Ks) vs E(V − I) obtained based on procedure from Pietrukowicz et al. (2015). The merged dataset used in this section is displayed with black dots. RR Lyrae variables approximately located in the X and Y plane at the position of spikes (see bottom panels of Fig. 7) are marked with red and blue markers. The green line represents the identity line.
Current usage metrics show cumulative count of Article Views (full-text article views including HTML views, PDF and ePub downloads, according to the available data) and Abstracts Views on Vision4Press platform.
Data correspond to usage on the plateform after 2015. The current usage metrics is available 48-96 hours after online publication and is updated daily on week days.
Initial download of the metrics may take a while.