Fig. D.8
Download original image
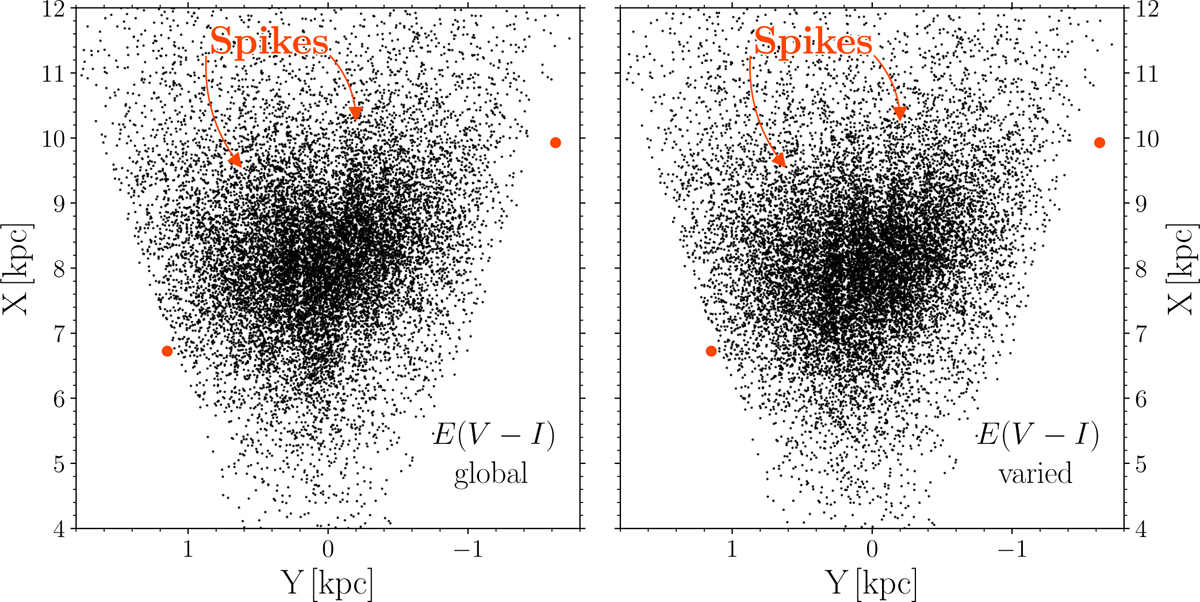
Spatial distribution of RR Lyrae pulsators in the Cartesian space for two versions of reddening law. The left and right panels show spatial distribution with reddening determined through a single and varied (see Table 4) reddening law, respectively. We note that we used the same dataset as for Fig. 7. The two red dots represent the first and last position of the bar (Gonzalez et al. 2011).
Current usage metrics show cumulative count of Article Views (full-text article views including HTML views, PDF and ePub downloads, according to the available data) and Abstracts Views on Vision4Press platform.
Data correspond to usage on the plateform after 2015. The current usage metrics is available 48-96 hours after online publication and is updated daily on week days.
Initial download of the metrics may take a while.