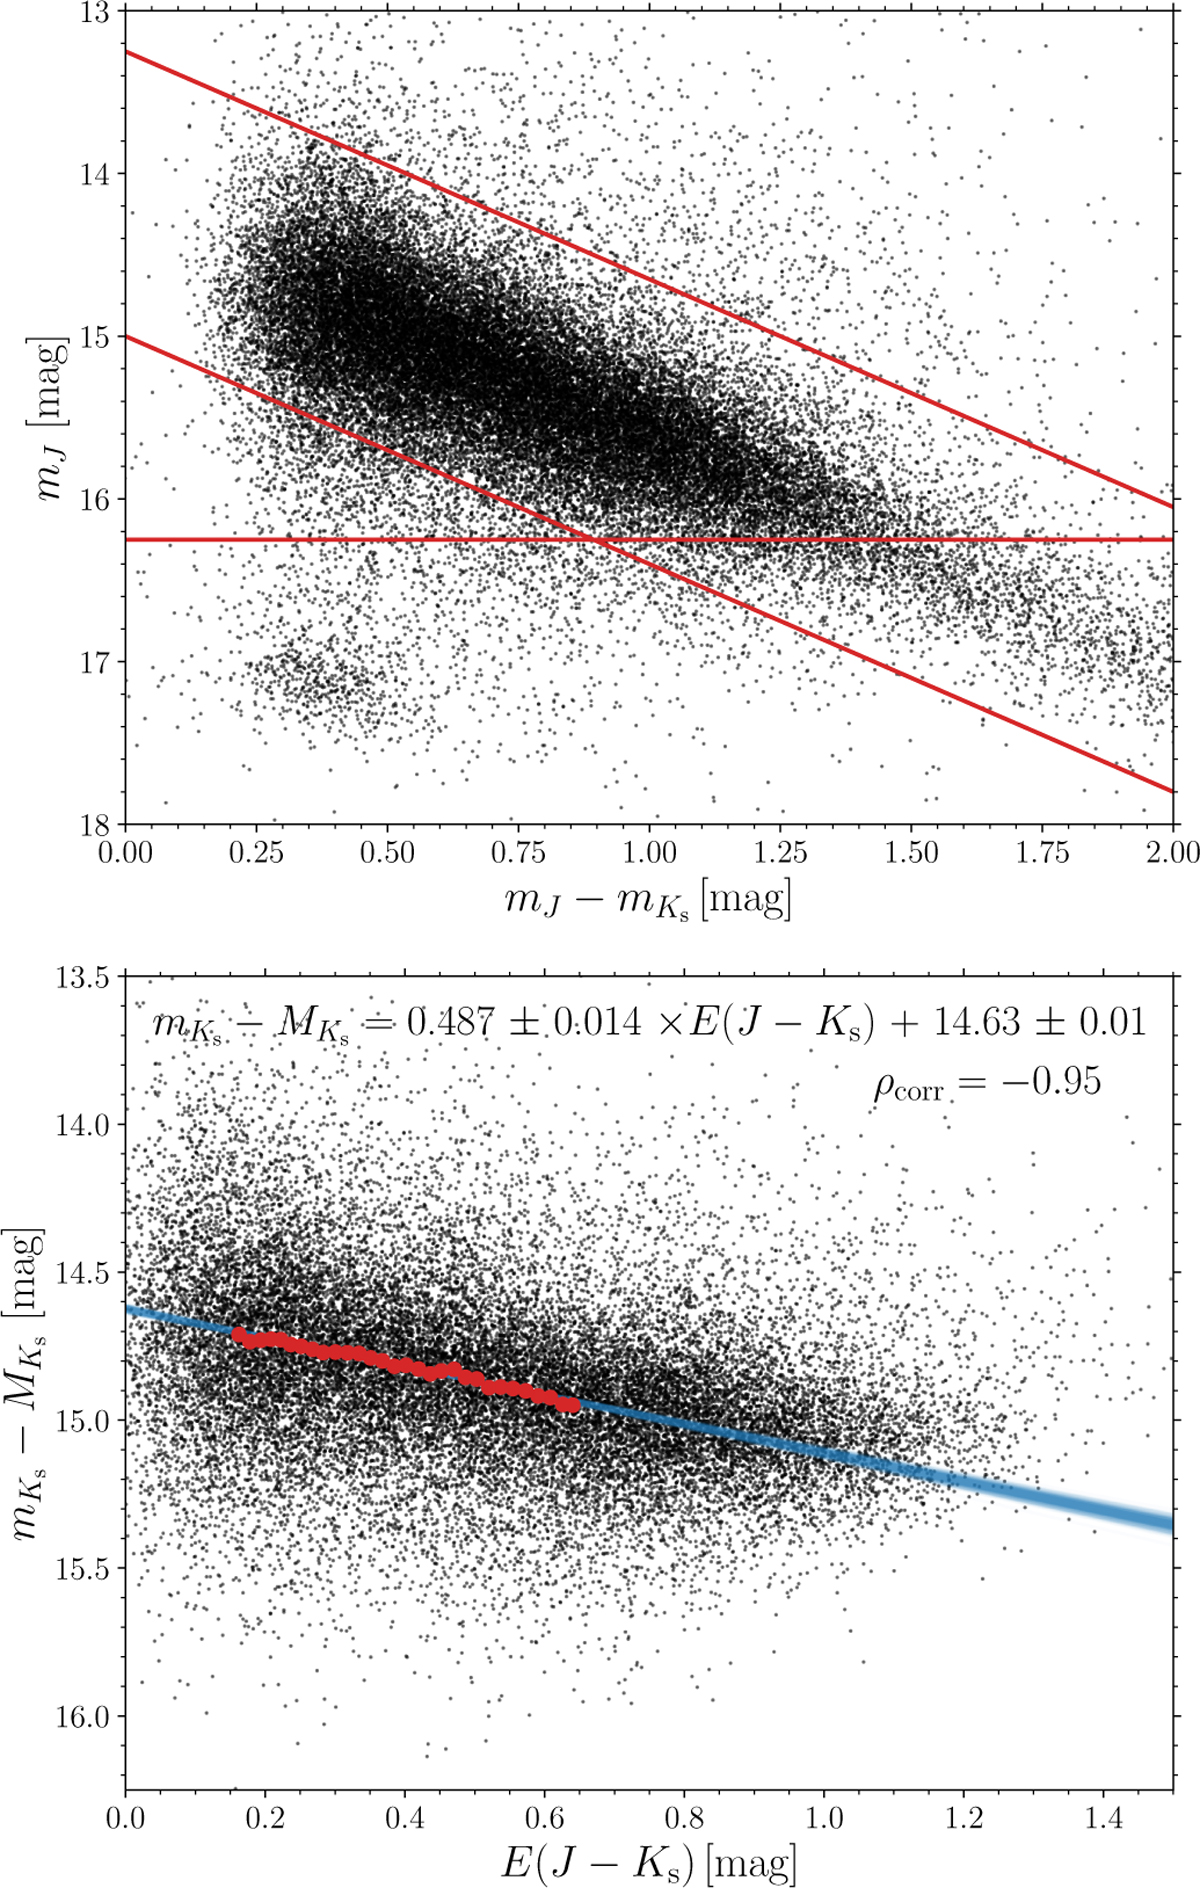
Fig. D.1
Download original image
Color-magnitude diagram (top panel) and linear dependence between color excess E (J − Ks) (lower panel) versus the difference of mean intensity and absolute magnitudes. In the top panel, we plot all sample stars. The red lines denote conditions listed in Table 2 for the selection of bulge RR Lyrae sub-sample. In the bottom panel, the black dots represent selected stars from our sample, blue lines represent the reddening vector, and red circles depict individual bins.
Current usage metrics show cumulative count of Article Views (full-text article views including HTML views, PDF and ePub downloads, according to the available data) and Abstracts Views on Vision4Press platform.
Data correspond to usage on the plateform after 2015. The current usage metrics is available 48-96 hours after online publication and is updated daily on week days.
Initial download of the metrics may take a while.