Fig. 2
Download original image
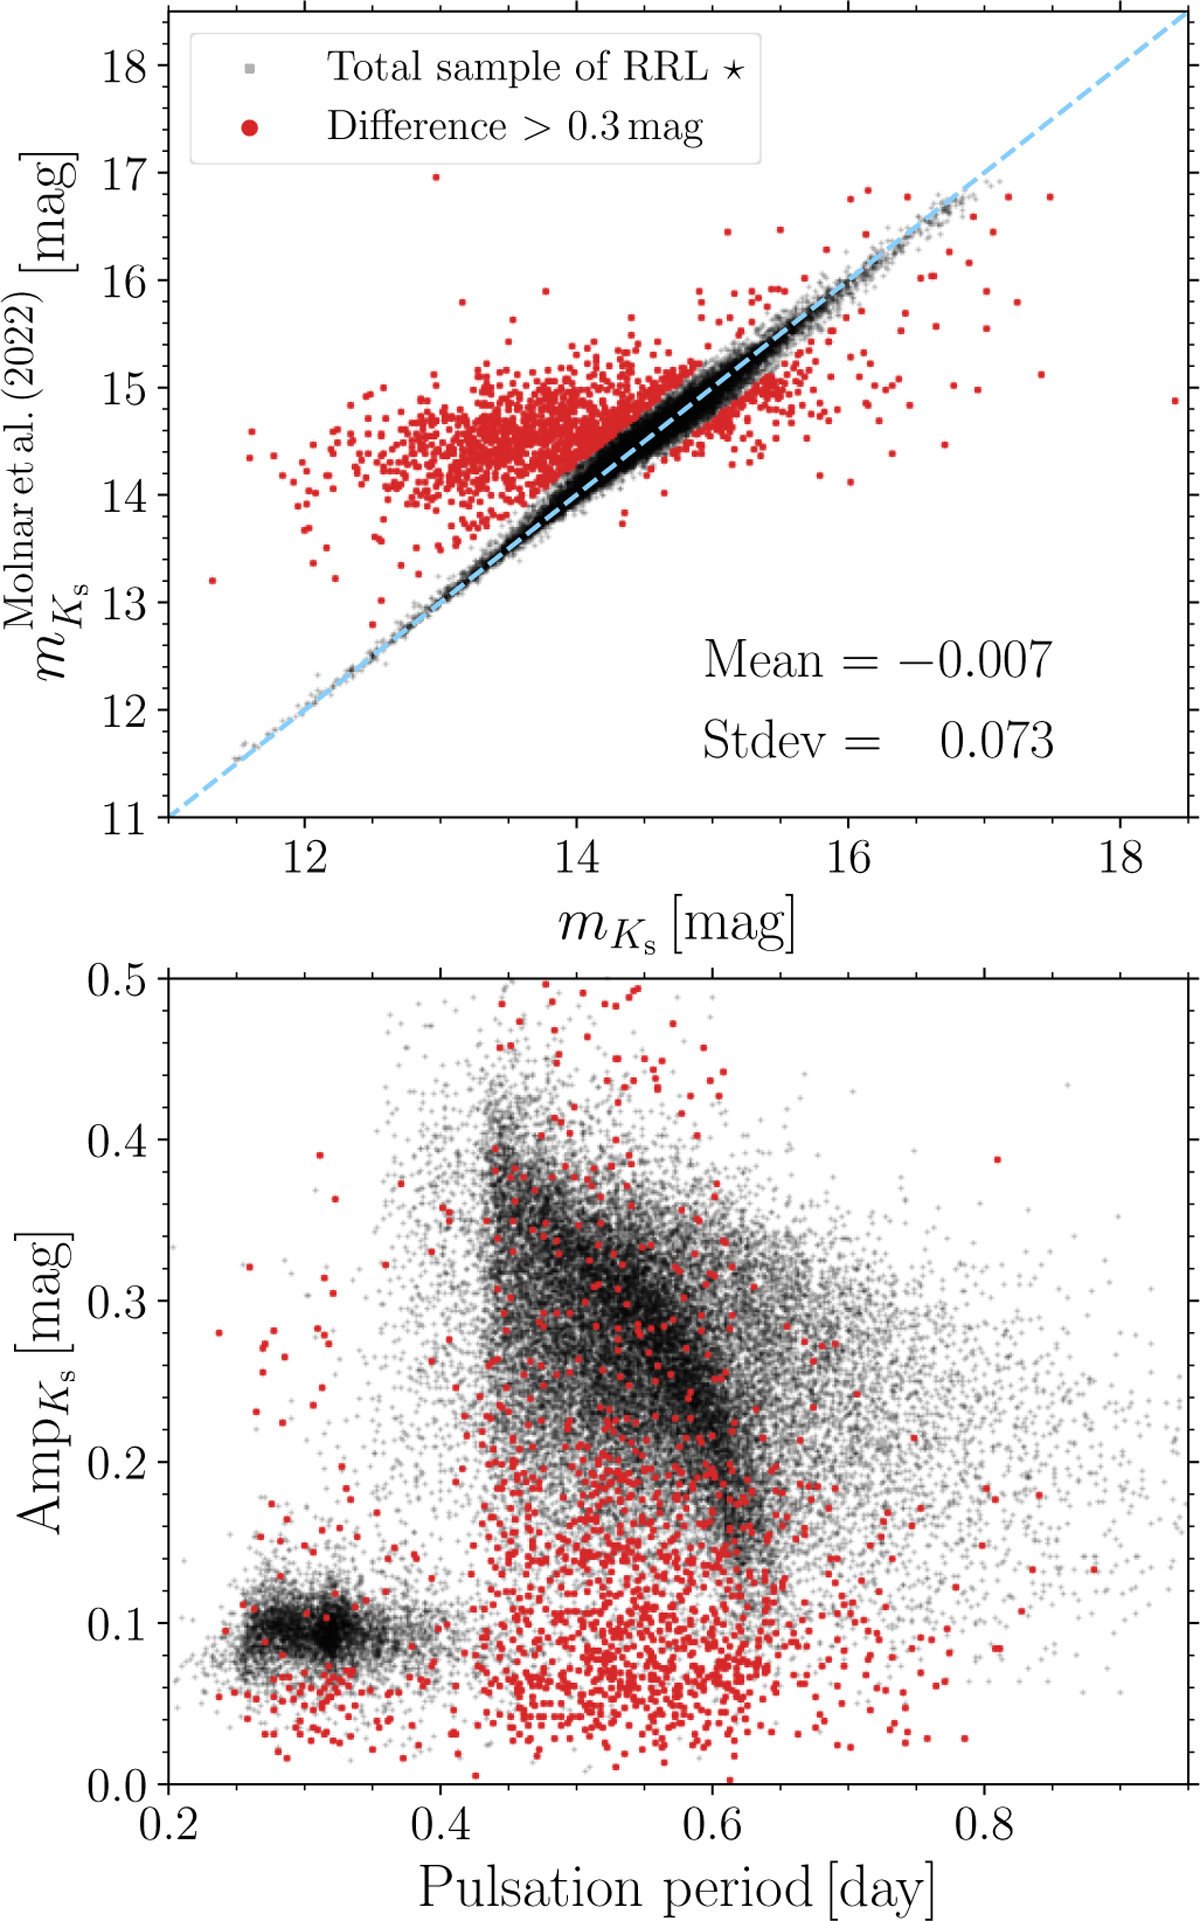
Comparison of matched RR Lyrae stars in mean intensity magnitude space (top panel) and period-amplitude plane (bottom panel). The gray dots in both panels represent the total cross-matched sample (between our aperture VVV data and sample provided in Molnar et al. 2022), and red points stand for stars where the absolute difference between both mean intensity magnitudes exceeded 0.3 mag. To assess both photometric sources, we listed the mean and standard deviation between both samples (with discrepant RR Lyrae stars removed). The blue line in the top panel represents the identity line.
Current usage metrics show cumulative count of Article Views (full-text article views including HTML views, PDF and ePub downloads, according to the available data) and Abstracts Views on Vision4Press platform.
Data correspond to usage on the plateform after 2015. The current usage metrics is available 48-96 hours after online publication and is updated daily on week days.
Initial download of the metrics may take a while.