Fig. 16
Download original image
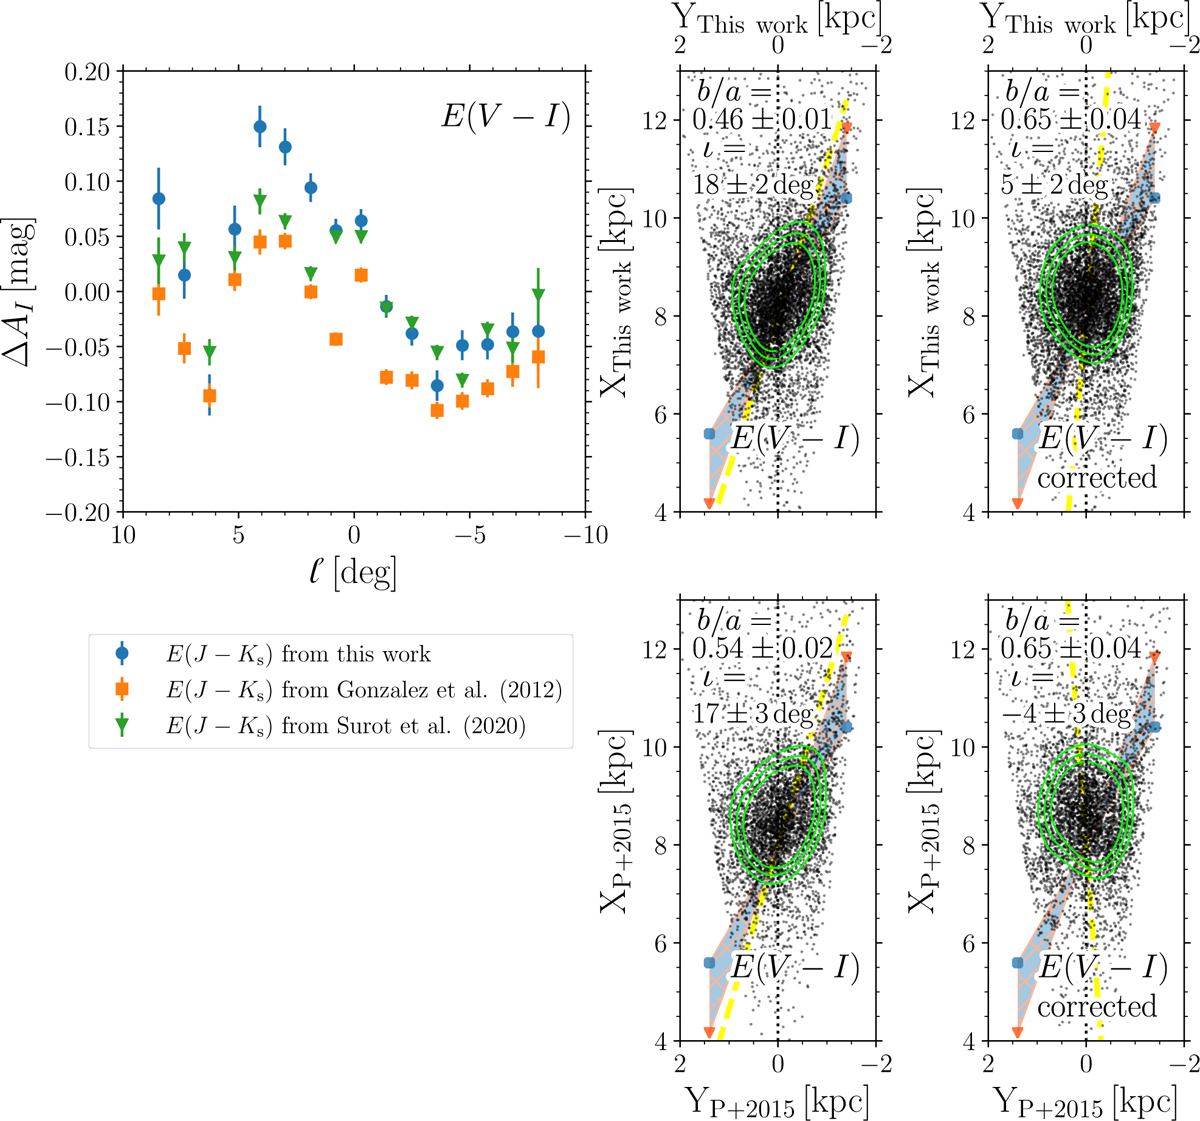
Comparison of spatial distribution estimated through visual passbands in this work (top middle and right panels) and using the method described in Pietrukowicz et al. (2015, marked as P+2015) (bottom middle and right panels) also based partially on visual bands. The top right panel shows a variation in A¡ extinction as a function of the Galactic longitude, estimated using three sources for E (J – Ks) from this work (blue points), form Gonzalez et al. (2012, orange squares), and from Surot et al. (2020, green triangles). The red triangles and blue circles represent two bar angles 20 and 30 degrees, respectively, with shading representing the angles in between. Same as in Fig. 6, the dashed yellow and dotted black lines represent the measured and zero angles, respectively. Lastly, the χ2 of ellipse fits from the top middle panel to the bottom-right hand plot are 0.38, 0.31, 0.25, and 0.18.
Current usage metrics show cumulative count of Article Views (full-text article views including HTML views, PDF and ePub downloads, according to the available data) and Abstracts Views on Vision4Press platform.
Data correspond to usage on the plateform after 2015. The current usage metrics is available 48-96 hours after online publication and is updated daily on week days.
Initial download of the metrics may take a while.