Fig. 14
Download original image
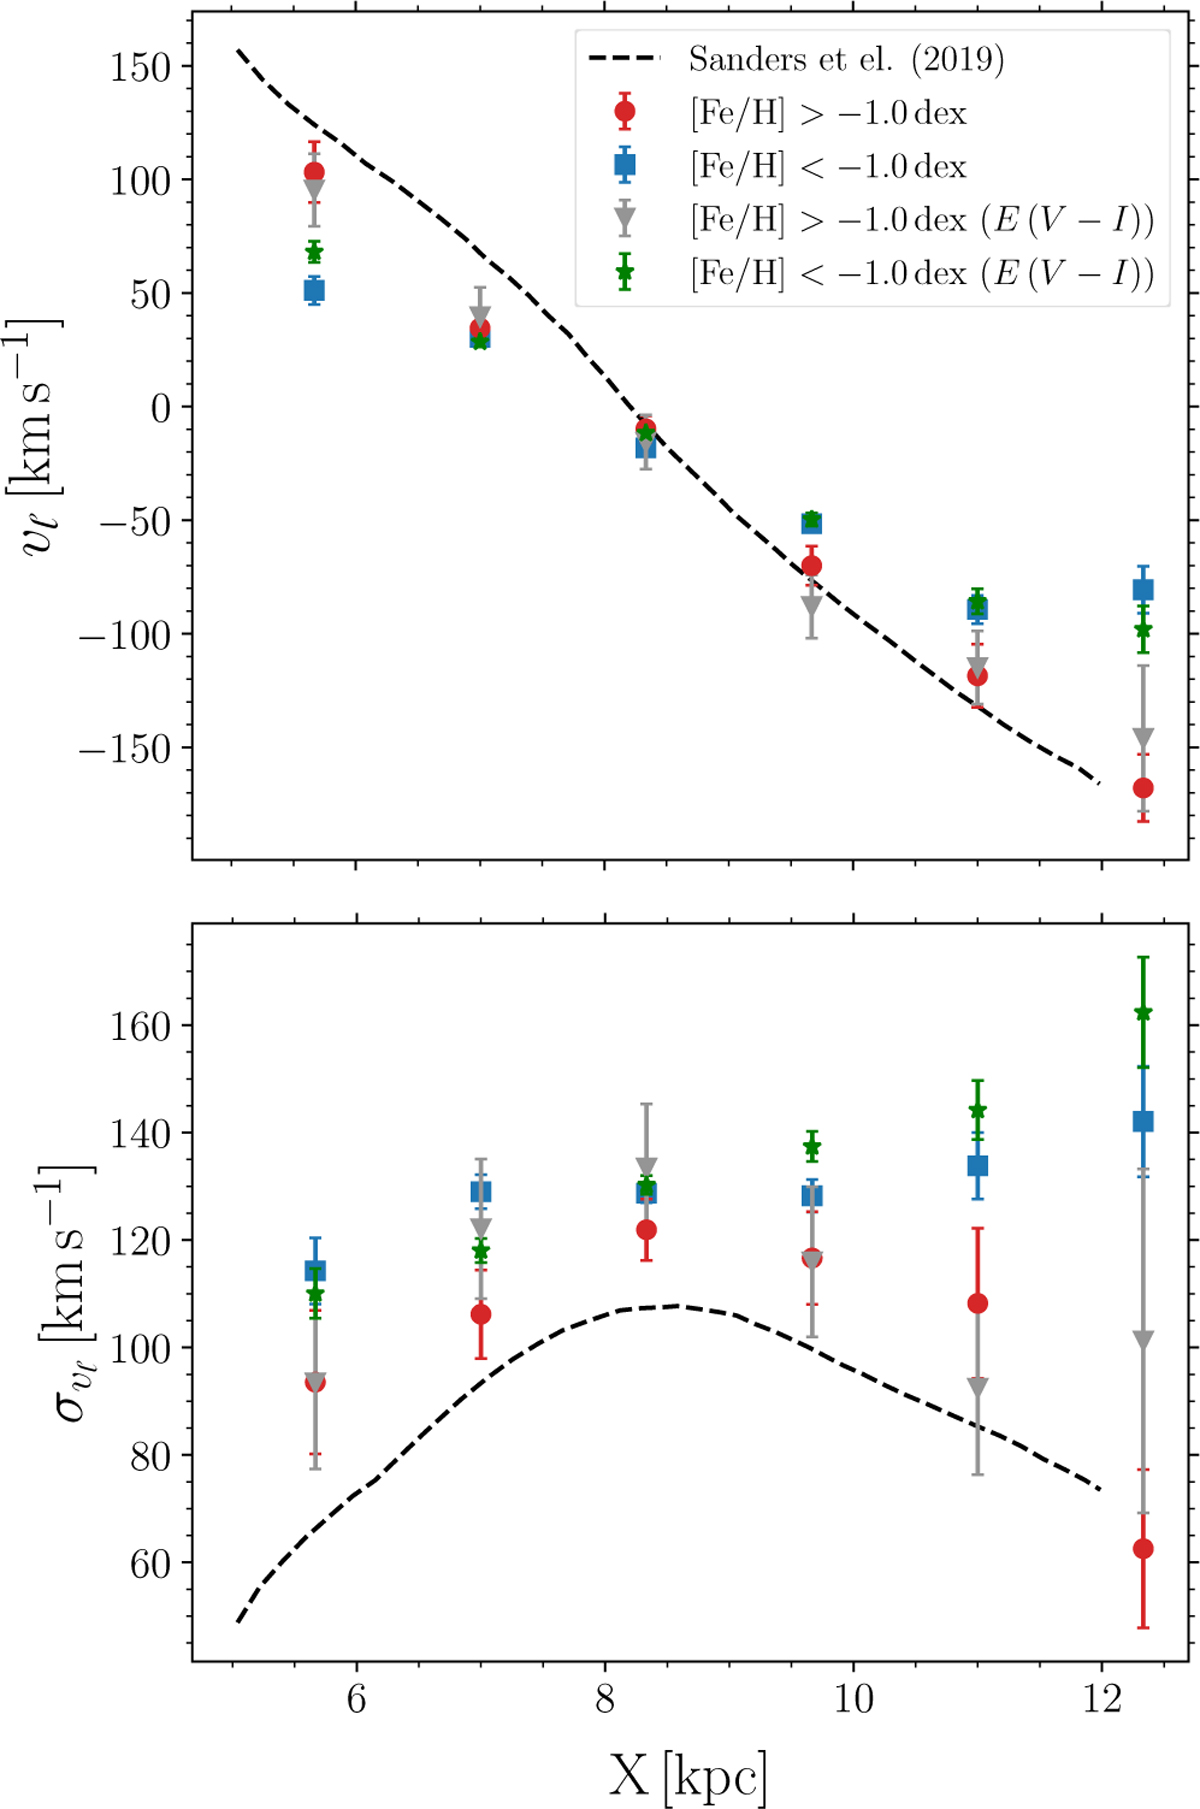
Distribution of vℓ and ![]() vs. X coordinate. The top panel shows how vℓ changes with different distances from the Sun for two metallicity bins, metal-rich (denoted with red points) and metal-poor (represented by blue squares). The dashed black line represents results from Sanders et al. (2019) for RC stars. The bottom panel presents a dispersion profile of vℓ over the same distance range with the same two metallicity samples. The black line again represents the results from Sanders et al. (2019) for the dispersion of RC giants. The gray and green markers denote the same metallicity bins (metal-rich and metal-poor) but for transverse velocities, dispersions, and X-coordinates estimated using distance based on visual passbands, showing that the transverse velocities do not significantly depend on the extinction map used. Similar to Fig. 13, all stars were selected within |ℓ| < 2 deg.
vs. X coordinate. The top panel shows how vℓ changes with different distances from the Sun for two metallicity bins, metal-rich (denoted with red points) and metal-poor (represented by blue squares). The dashed black line represents results from Sanders et al. (2019) for RC stars. The bottom panel presents a dispersion profile of vℓ over the same distance range with the same two metallicity samples. The black line again represents the results from Sanders et al. (2019) for the dispersion of RC giants. The gray and green markers denote the same metallicity bins (metal-rich and metal-poor) but for transverse velocities, dispersions, and X-coordinates estimated using distance based on visual passbands, showing that the transverse velocities do not significantly depend on the extinction map used. Similar to Fig. 13, all stars were selected within |ℓ| < 2 deg.
Current usage metrics show cumulative count of Article Views (full-text article views including HTML views, PDF and ePub downloads, according to the available data) and Abstracts Views on Vision4Press platform.
Data correspond to usage on the plateform after 2015. The current usage metrics is available 48-96 hours after online publication and is updated daily on week days.
Initial download of the metrics may take a while.