Fig. 13
Download original image
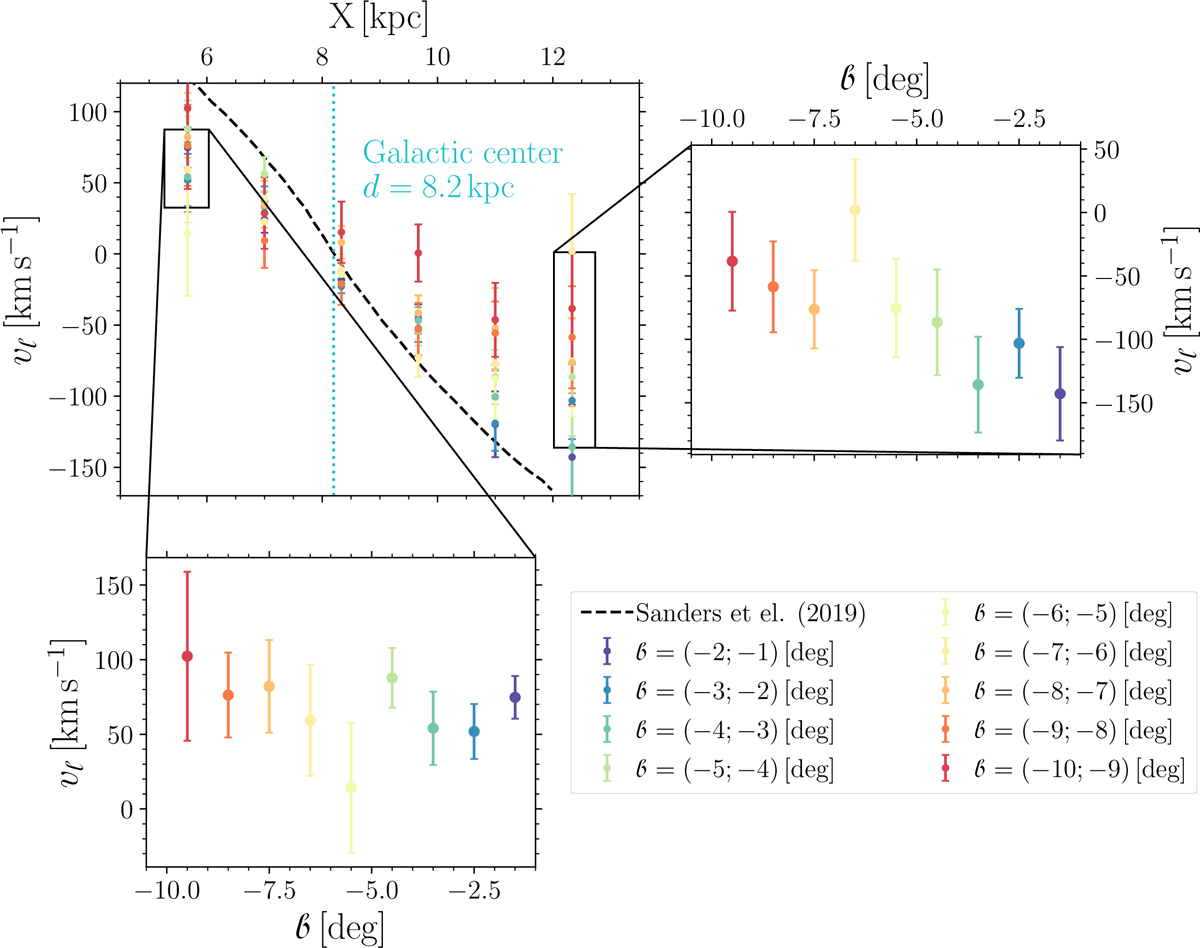
Distribution of vℓ at different distances and Galactic latitudes below the Galactic plane. The top left panel shows the dependence of vℓ on the distance toward the Galactic bulge color-coded according to on different Galactic latitudes. The dashed black line represents the approximate distribution of vℓ from Sanders et al. (2019), and the dotted light blue line represents the distance to the Galactic center. The top right and bottom left panels show insets for two bins from the top left plot, particularly for X bins at 5.67 kpc and 12.33 kpc, respectively, with the same color-coding as in the top left panel. All stars were selected within |ℓ| < 2 deg. For the same figure but for stars above the Galactic plane see Fig. D.10.
Current usage metrics show cumulative count of Article Views (full-text article views including HTML views, PDF and ePub downloads, according to the available data) and Abstracts Views on Vision4Press platform.
Data correspond to usage on the plateform after 2015. The current usage metrics is available 48-96 hours after online publication and is updated daily on week days.
Initial download of the metrics may take a while.