Fig. 11
Download original image
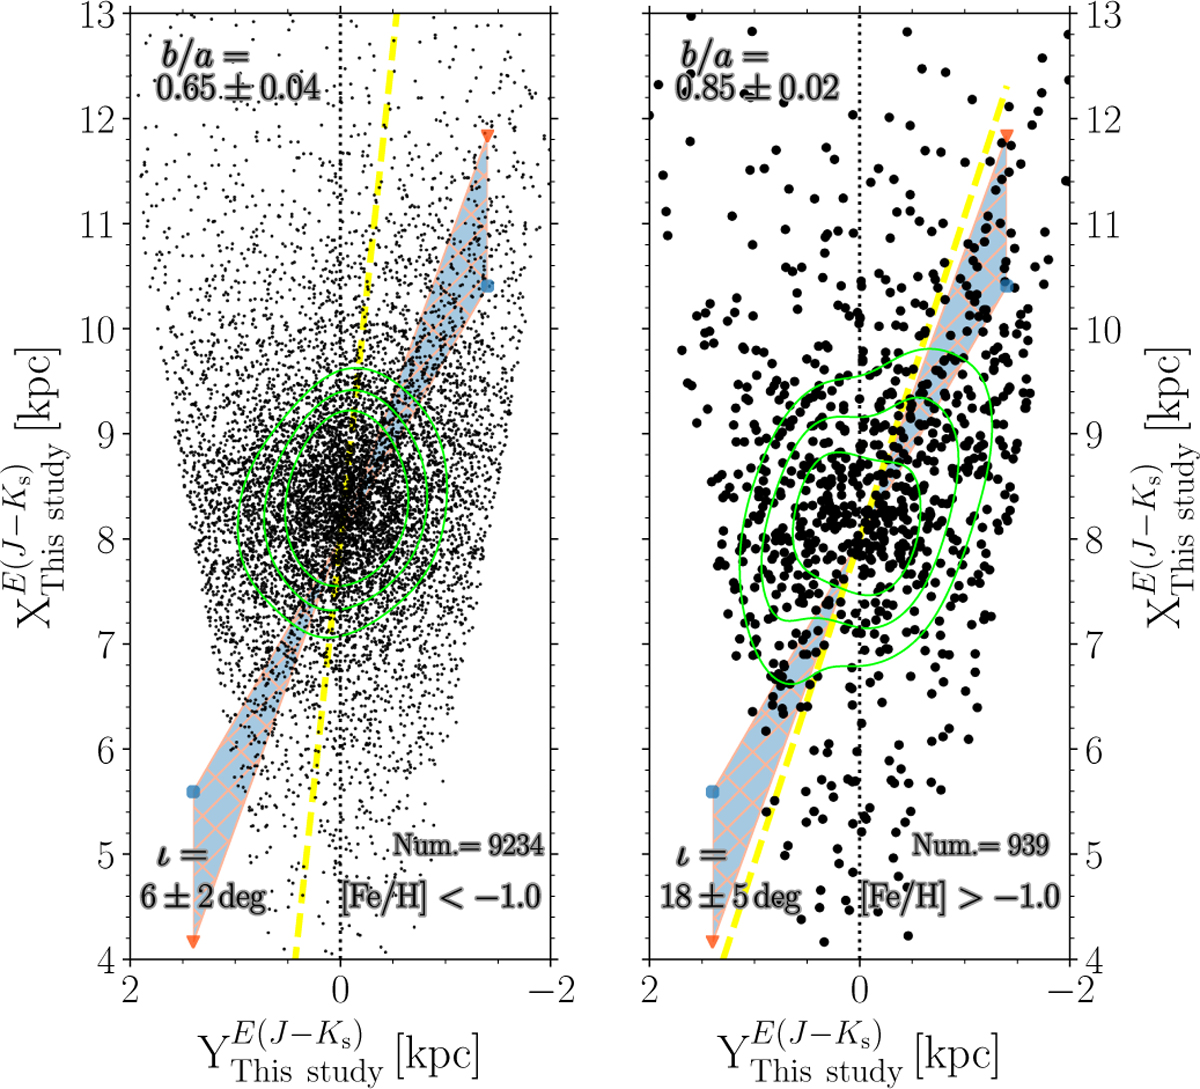
Spatial distribution analysis for near-IR distances derived using E(J − Ks). The right and left panels show metal-poor ([Fe/H]phot < −1.0 dex) and metal-rich ([Fe/H]phot > −1.0 dex) RR Lyrae variables in our dataset (black dots). Two approximate bar angles (20 and 30 degrees) are shown with red triangles and blue circles, respectively with shading marking the angles in between. Similar to Fig. 6, we show measured and zero angles with dashed yellow and dotted black lines. Lastly, the quality of the ellipse fit for the left panel is χ2 = 0.45.
Current usage metrics show cumulative count of Article Views (full-text article views including HTML views, PDF and ePub downloads, according to the available data) and Abstracts Views on Vision4Press platform.
Data correspond to usage on the plateform after 2015. The current usage metrics is available 48-96 hours after online publication and is updated daily on week days.
Initial download of the metrics may take a while.