Fig. 10
Download original image
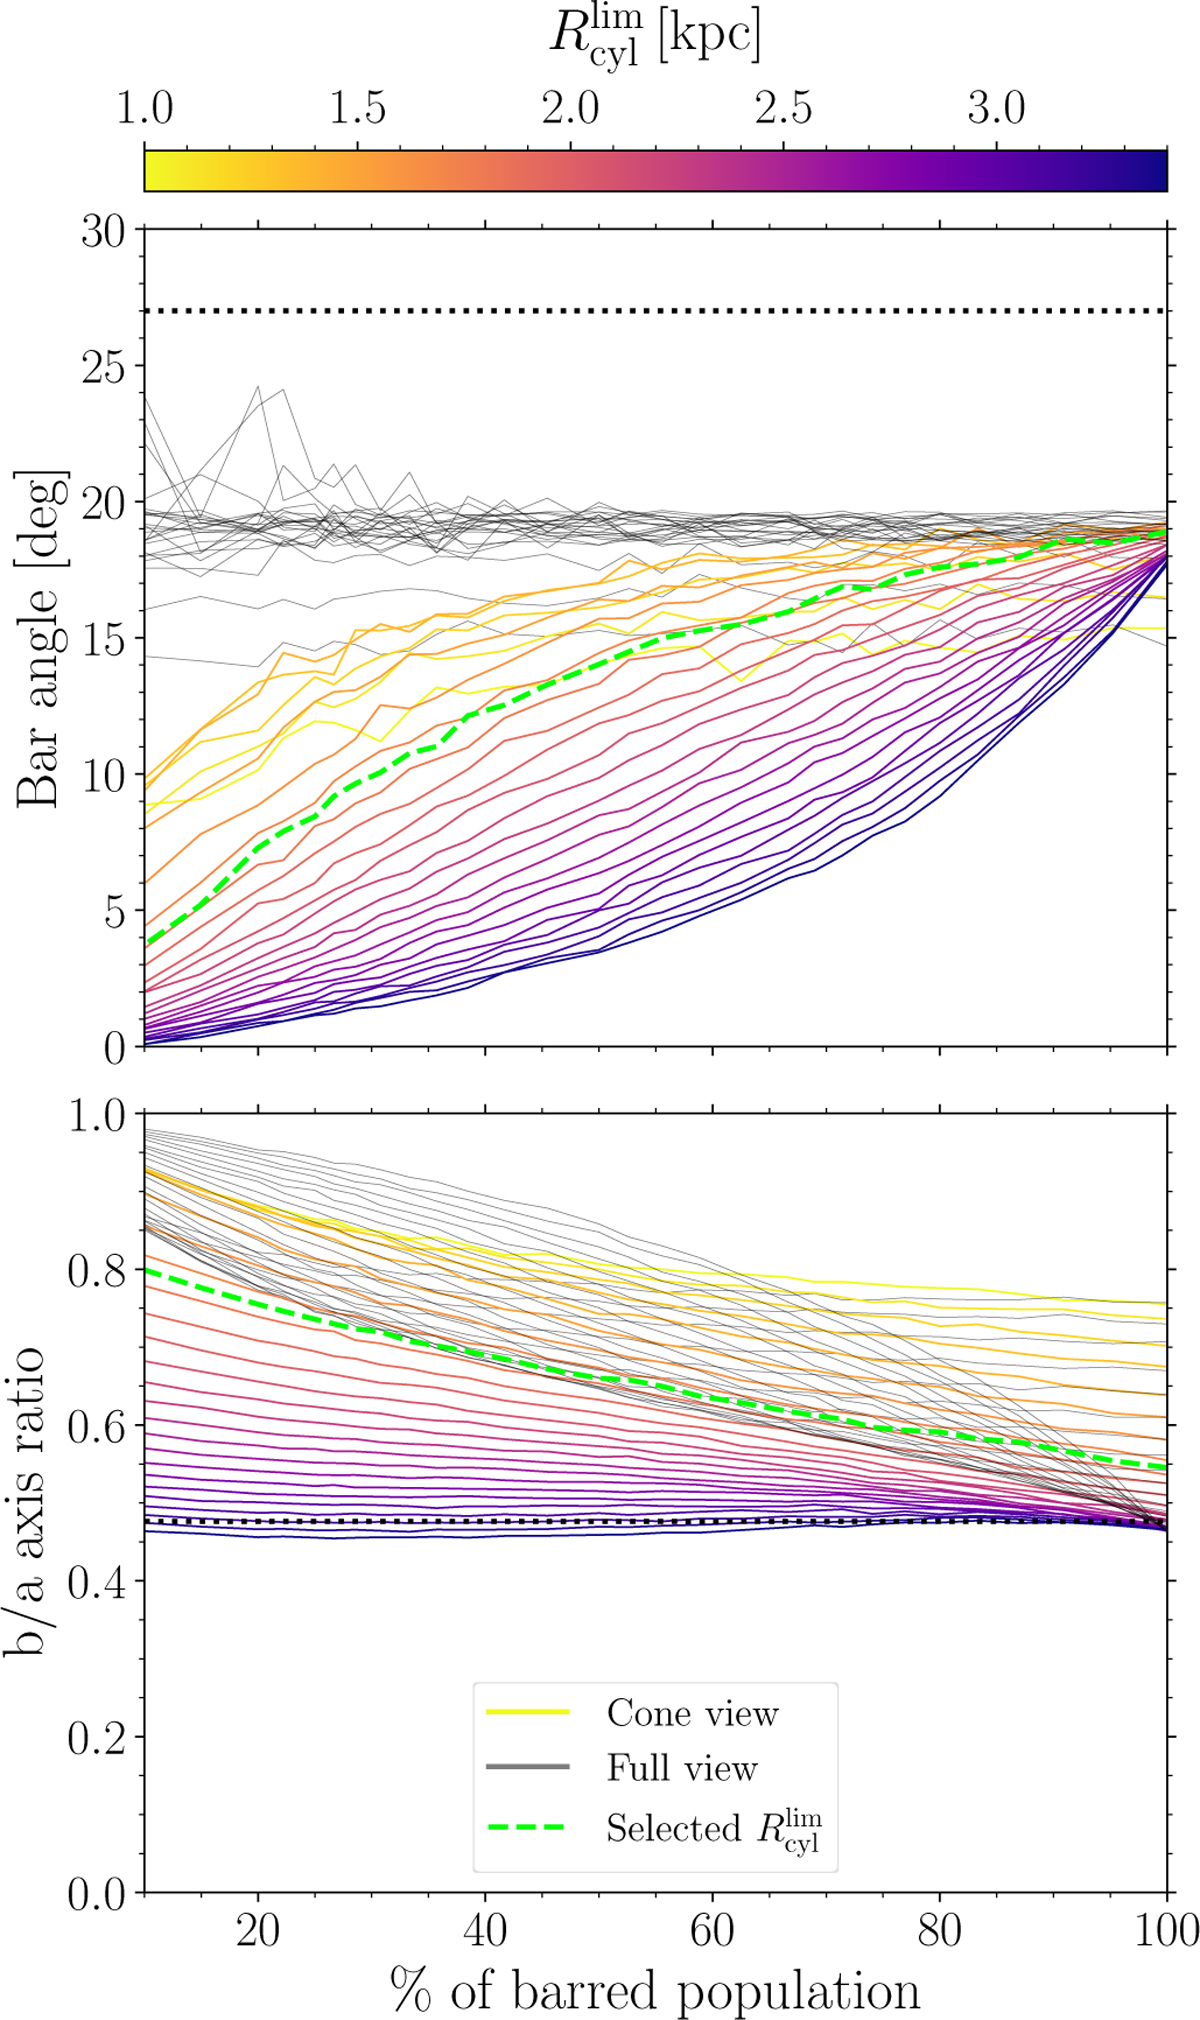
Test of the inertia tensor method for estimating the bar angle (top panel) and the b/a axis ratio (bottom panel) for our simulated dataset. The solid black lines represent the simulated, unrestricted view of the Galactic bar for different values of ![]() . The solid color-coded lines show measurements for different
. The solid color-coded lines show measurements for different ![]() in the cone view of the Galactic bar. The dashed green line indicates the selected value of
in the cone view of the Galactic bar. The dashed green line indicates the selected value of ![]() kpc used in our observational dataset. The dotted black line in both panels denotes the true value of the bar angle and axis ratio set for the ellipsoidal distribution.
kpc used in our observational dataset. The dotted black line in both panels denotes the true value of the bar angle and axis ratio set for the ellipsoidal distribution.
Current usage metrics show cumulative count of Article Views (full-text article views including HTML views, PDF and ePub downloads, according to the available data) and Abstracts Views on Vision4Press platform.
Data correspond to usage on the plateform after 2015. The current usage metrics is available 48-96 hours after online publication and is updated daily on week days.
Initial download of the metrics may take a while.