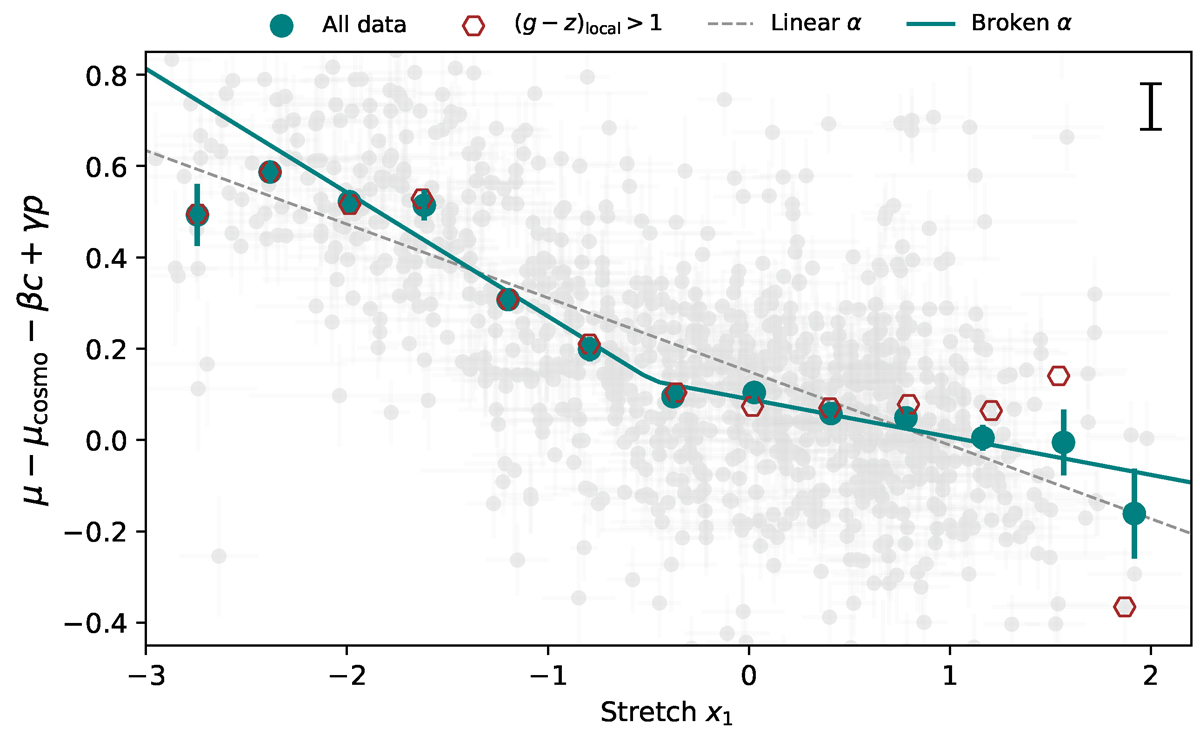
Fig. 8.
Download original image
Standardised Hubble residuals (α = 0) as a function of stretch (x1). Large blue points show the data binned by stretch (mean) while the red hexagons show the binned stretch for SNe Ia from locally red environments. The errorbars on the binned points only display the error on the mean, but a reference for the fitted intrinsic scatter σint is plotted in the top-right corner. The blue line shows the best fitted broken-α model, while the dashed grey line shows the best α when assuming the linear Tripp relation.
Current usage metrics show cumulative count of Article Views (full-text article views including HTML views, PDF and ePub downloads, according to the available data) and Abstracts Views on Vision4Press platform.
Data correspond to usage on the plateform after 2015. The current usage metrics is available 48-96 hours after online publication and is updated daily on week days.
Initial download of the metrics may take a while.