Fig. 4.
Download original image
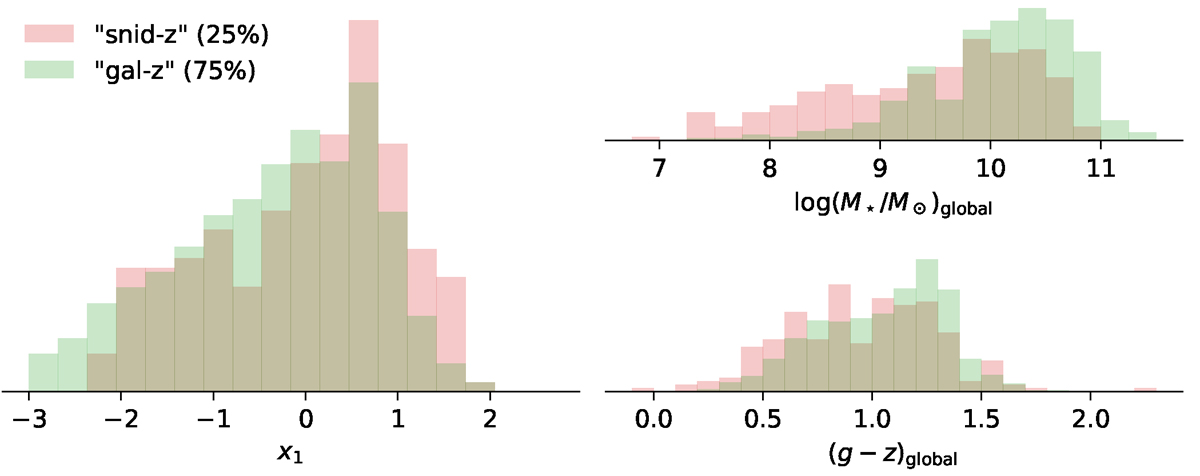
SN Ia light-curve stretch (x1), global host mass (log(M*/M⊙)global), and local environmental colour ((g − z)local) distributions split per redshift origin. SNe Ia with galaxy redshifts are plotted in green (σz ∼ 10−4), and SNe Ia relying on low-resolution SN spectra (extracted from SEDm, Blagorodnova et al. 2018), either from SNID (Blondin & Tonry 2007) or on host emission lines are plotted in red (σz ∼ 10−3). The apparent stretch offset is explained by the selection function associated with galaxy redshifts, which favours high-mass hosts.
Current usage metrics show cumulative count of Article Views (full-text article views including HTML views, PDF and ePub downloads, according to the available data) and Abstracts Views on Vision4Press platform.
Data correspond to usage on the plateform after 2015. The current usage metrics is available 48-96 hours after online publication and is updated daily on week days.
Initial download of the metrics may take a while.