Fig. 3.
Download original image
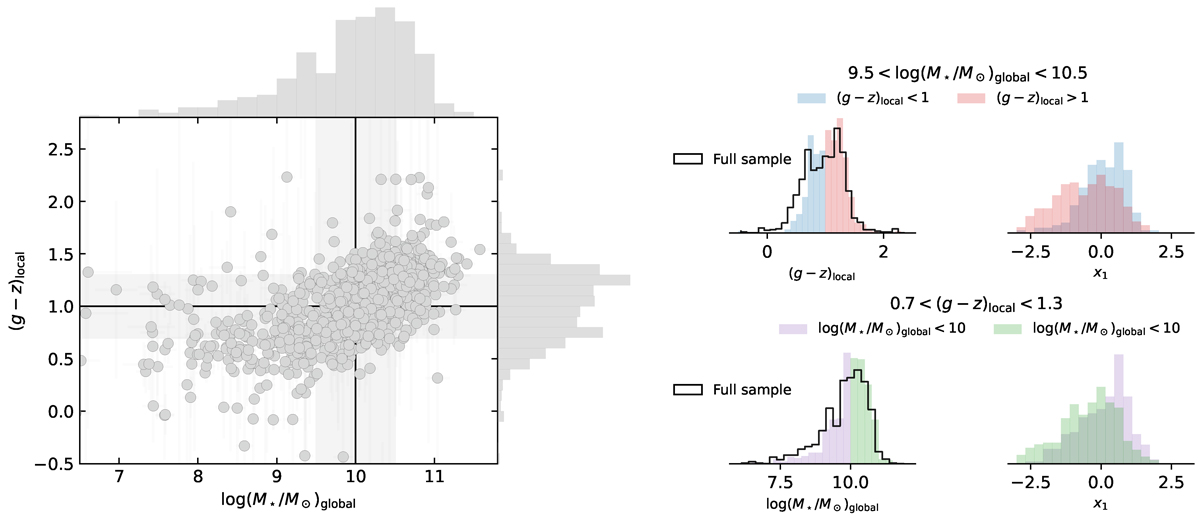
Connections between SN Ia light-curve stretch (x1), global stellar mass (log(M*/M⊙)global), and local environmental colour ((g − z)local), illustrating the complex correlation between stretch and SN environmental properties. Left: Local colour vs global host stellar mass. The light grey band shows the 25%–75% percentile range for host global mass (vertical, [9.5, 10.5] dex) and local environmental colour (horizontal, [0.7, 1.3] mag). These cuts are used to select SNe Ia shown in the right panels. Top-right: Local environmental colour and SN stretch distributions for SNe Ia whose host global mass is in [9.5, 10.5] dex. Blue and red histograms show locally blue and red environment SNe Ia. The black histogram is the local colour distribution for the full sample. Bottom-right: Global host stellar mass and SN stretch distributions for SNe Ia whose local environmental colour is in [0.7, 1.3] mag. Purple and green histograms show low and high mass hosts SNe Ia.
Current usage metrics show cumulative count of Article Views (full-text article views including HTML views, PDF and ePub downloads, according to the available data) and Abstracts Views on Vision4Press platform.
Data correspond to usage on the plateform after 2015. The current usage metrics is available 48-96 hours after online publication and is updated daily on week days.
Initial download of the metrics may take a while.