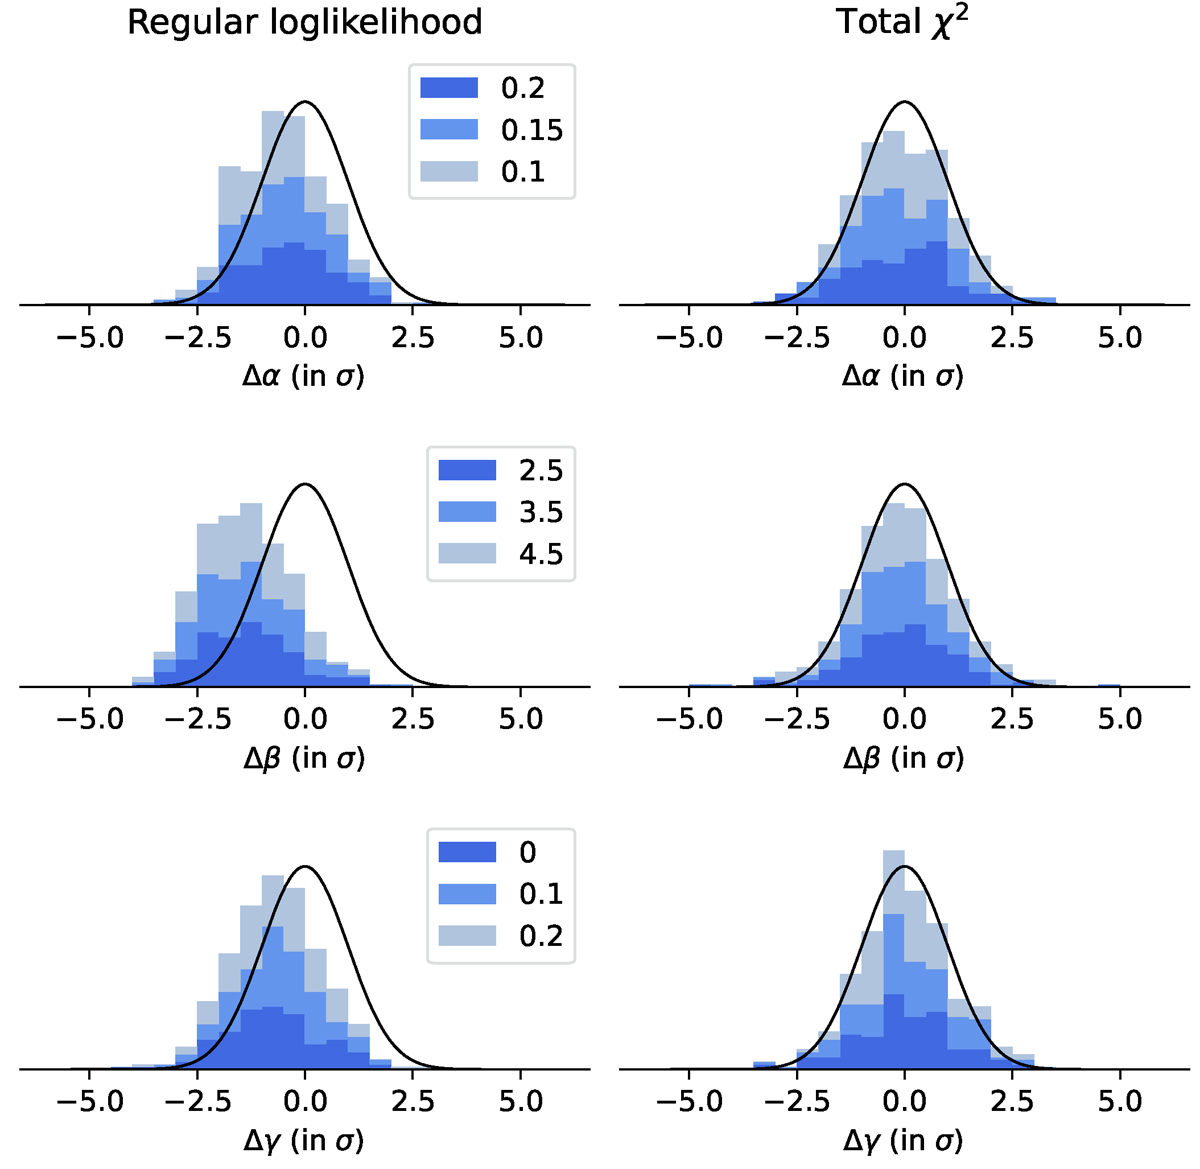
Fig. A.2.
Download original image
Left: Difference between the fitted (α, β, γ) and the input value when using a usual log-likelihood minimisation code, in σ. The stacked histograms corresponds to three different input values defined in the legend on the right. The black line is the model the histogram should follow if the results were unbiased (both values and error), which is a Gaussian with a null mean and unitary standard deviation. Right: Same as the left plot, but for the total-χ2 method.
Current usage metrics show cumulative count of Article Views (full-text article views including HTML views, PDF and ePub downloads, according to the available data) and Abstracts Views on Vision4Press platform.
Data correspond to usage on the plateform after 2015. The current usage metrics is available 48-96 hours after online publication and is updated daily on week days.
Initial download of the metrics may take a while.