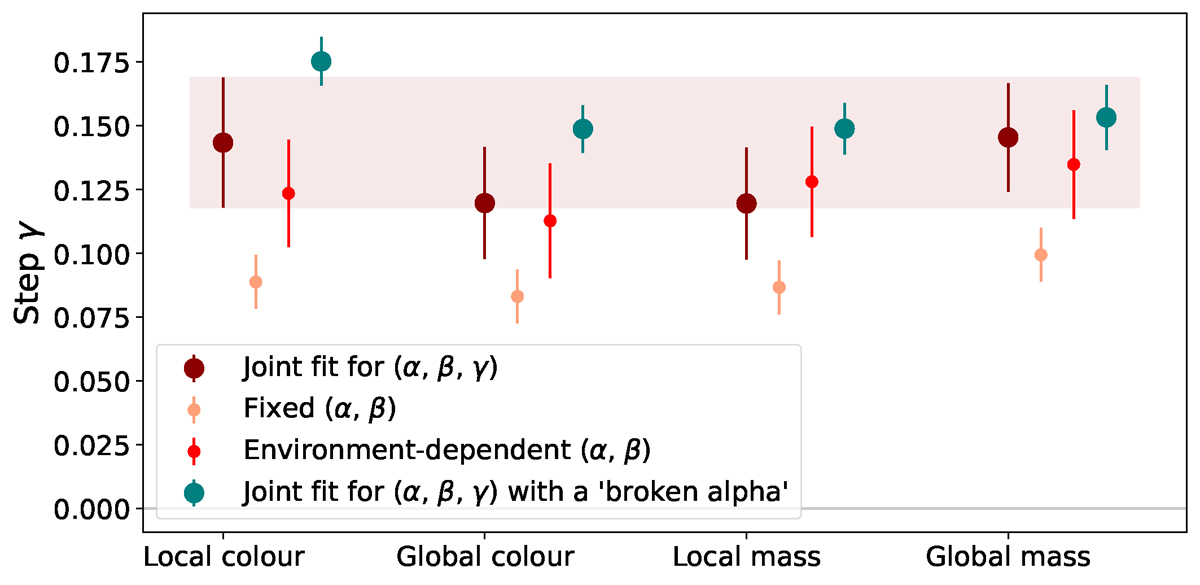
Fig. 10.
Download original image
Fitted steps for each of the environmental proxies. The dark red and green points indicate steps where both (α, β) and γ are fitted at the same time for each proxy. The light red points indicate the steps when the same (α, β) correction (fixed across proxies) is applied to the whole sample. The red points indicate the steps when independent (α, β) corrections are applied for each of the subsamples. The green points are steps when including the broken-α model into the fit, according to Sect. 4.5. The shaded band represents the 1σ interval for the reference step (local colour step from the joint fit).
Current usage metrics show cumulative count of Article Views (full-text article views including HTML views, PDF and ePub downloads, according to the available data) and Abstracts Views on Vision4Press platform.
Data correspond to usage on the plateform after 2015. The current usage metrics is available 48-96 hours after online publication and is updated daily on week days.
Initial download of the metrics may take a while.