Fig. 1.
Download original image
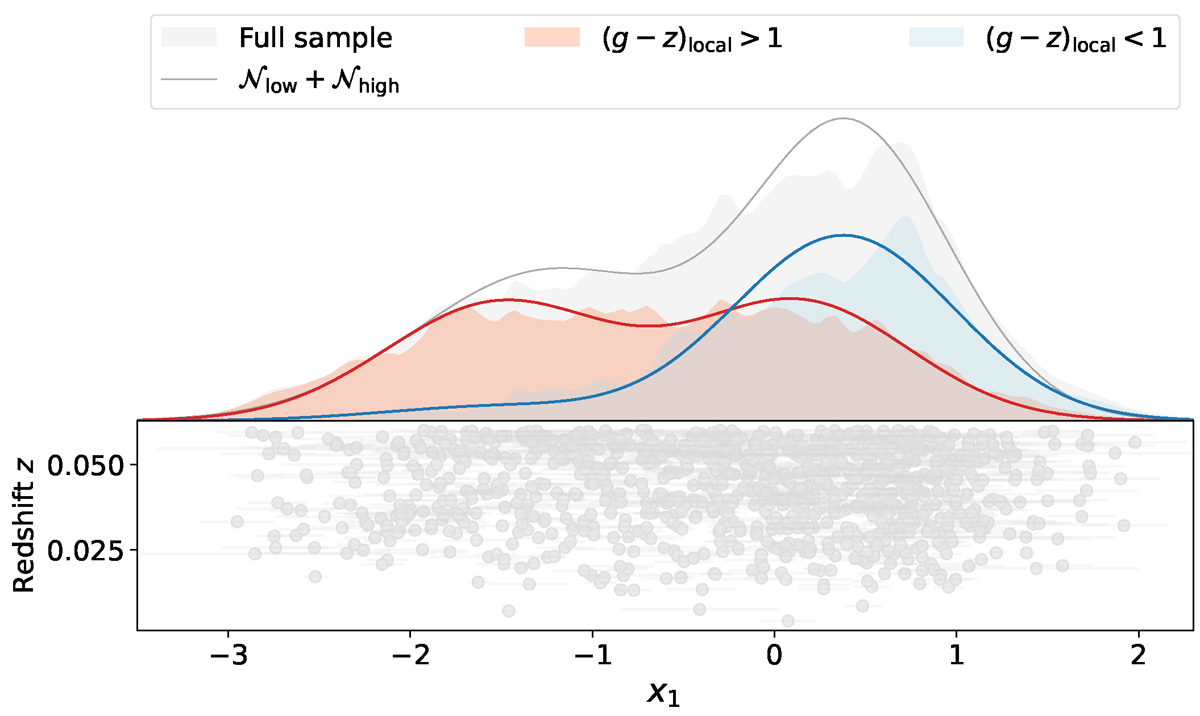
Top: Ideogram of the stretch distribution for the full sample (in grey), and for SNe in locally red and blue environments (509 and 429 SNe). The full grey line is the bimodal Gaussian from N21 described in Sect. 3, while the red and blue lines are bimodal Gaussian fits to the old and young progenitor subpopulations. Bottom: Stretch vs redshift, z. The fact that there is no depletion of low stretch SNe at a higher redshift is a consequence of the volume-limited cut.
Current usage metrics show cumulative count of Article Views (full-text article views including HTML views, PDF and ePub downloads, according to the available data) and Abstracts Views on Vision4Press platform.
Data correspond to usage on the plateform after 2015. The current usage metrics is available 48-96 hours after online publication and is updated daily on week days.
Initial download of the metrics may take a while.