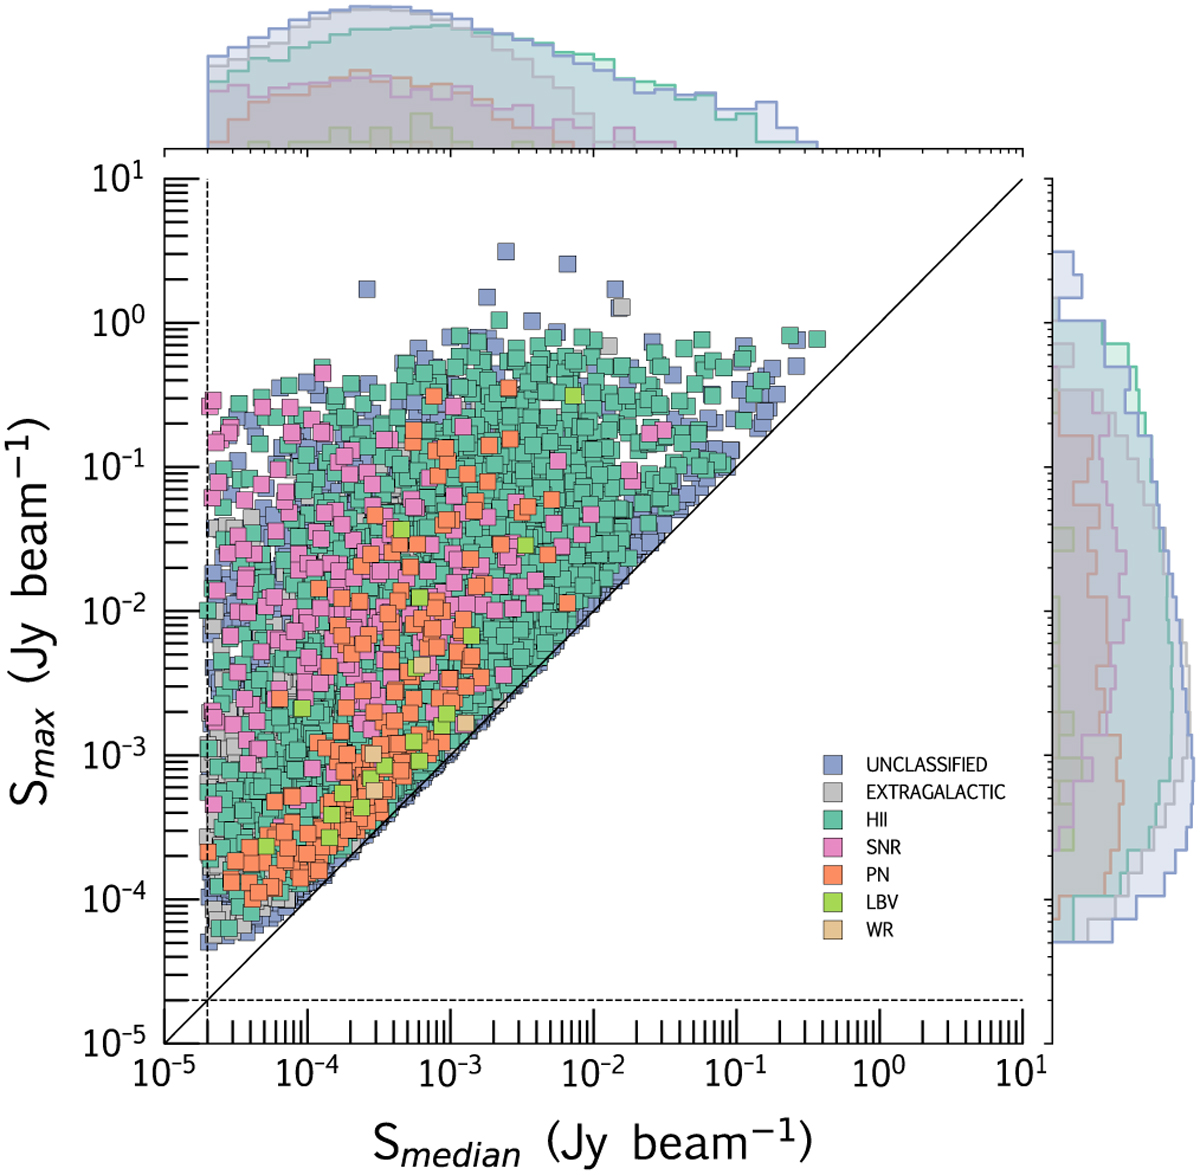
Fig. 6

Download original image
Scatter plot of the peak and median source brightness, coloured by source type. Histograms on the top and right show the counts per source type relative to each of the variables, in log scale. The solid line represents Smax = Smedian, and the dashed lines indicate the upper limit of the nominal off-source rms (10–20 µJy beam−1; Goedhart et al. 2024). Sources with median source brightness below this threshold (e.g. due to negative bowls) have been excluded from the plot.
Current usage metrics show cumulative count of Article Views (full-text article views including HTML views, PDF and ePub downloads, according to the available data) and Abstracts Views on Vision4Press platform.
Data correspond to usage on the plateform after 2015. The current usage metrics is available 48-96 hours after online publication and is updated daily on week days.
Initial download of the metrics may take a while.


