Fig. 4
Download original image
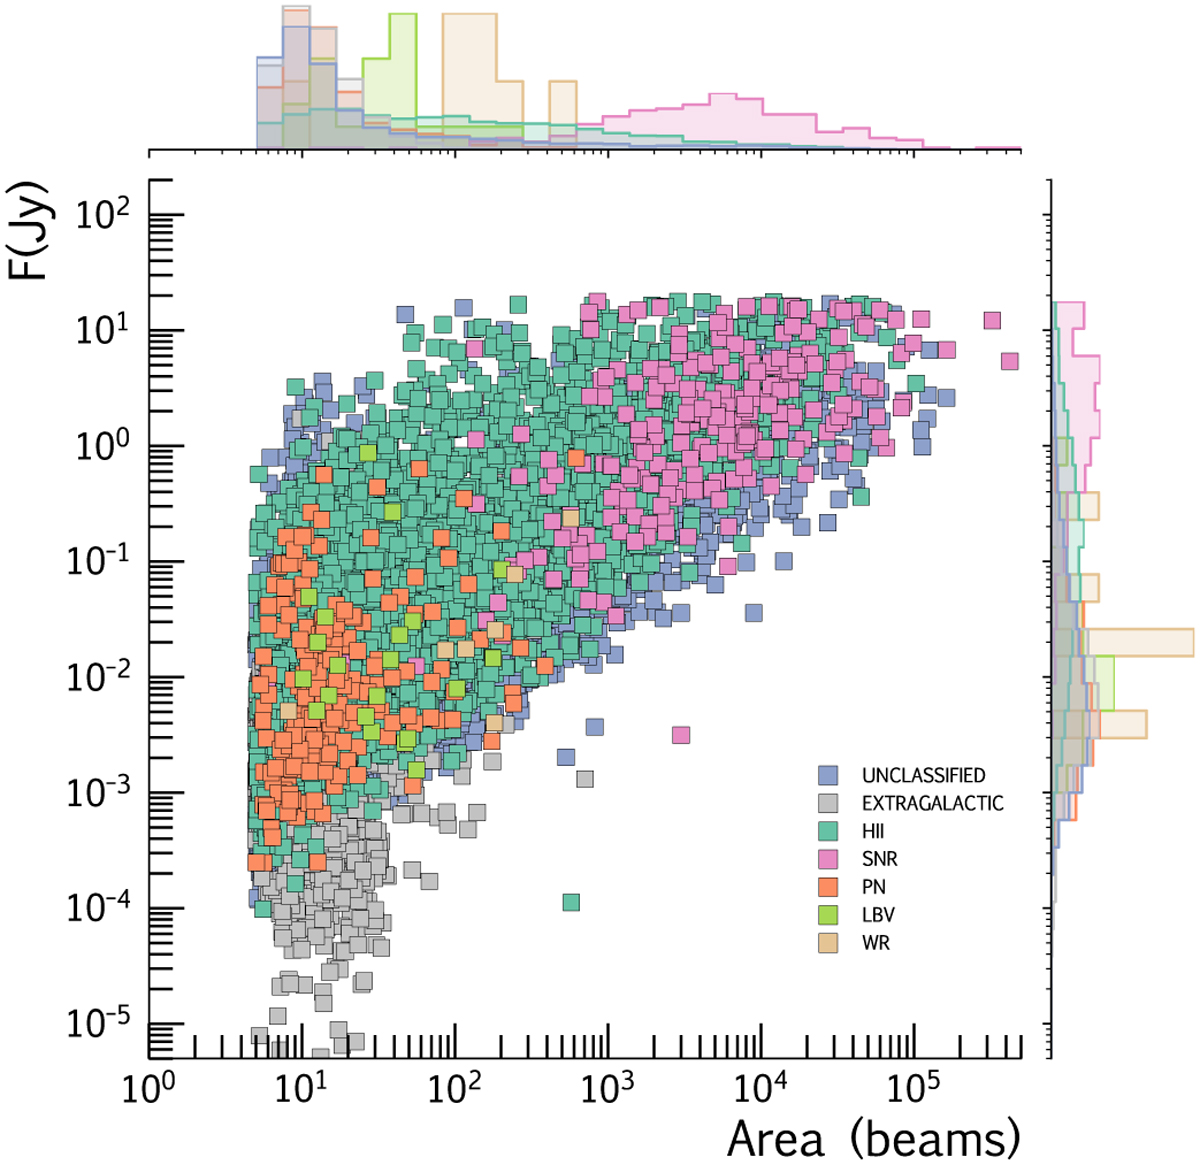
Scatter plot of flux density as a function of the source area (in beams), coloured by source type. Histograms on the top and right show the marginal source distribution per type relative to each of the variables. Each histogram represents the normalised density function, with normalisation performed independently for each source type to facilitate the visualisation of less represented types.
Current usage metrics show cumulative count of Article Views (full-text article views including HTML views, PDF and ePub downloads, according to the available data) and Abstracts Views on Vision4Press platform.
Data correspond to usage on the plateform after 2015. The current usage metrics is available 48-96 hours after online publication and is updated daily on week days.
Initial download of the metrics may take a while.