Fig. 3
Download original image
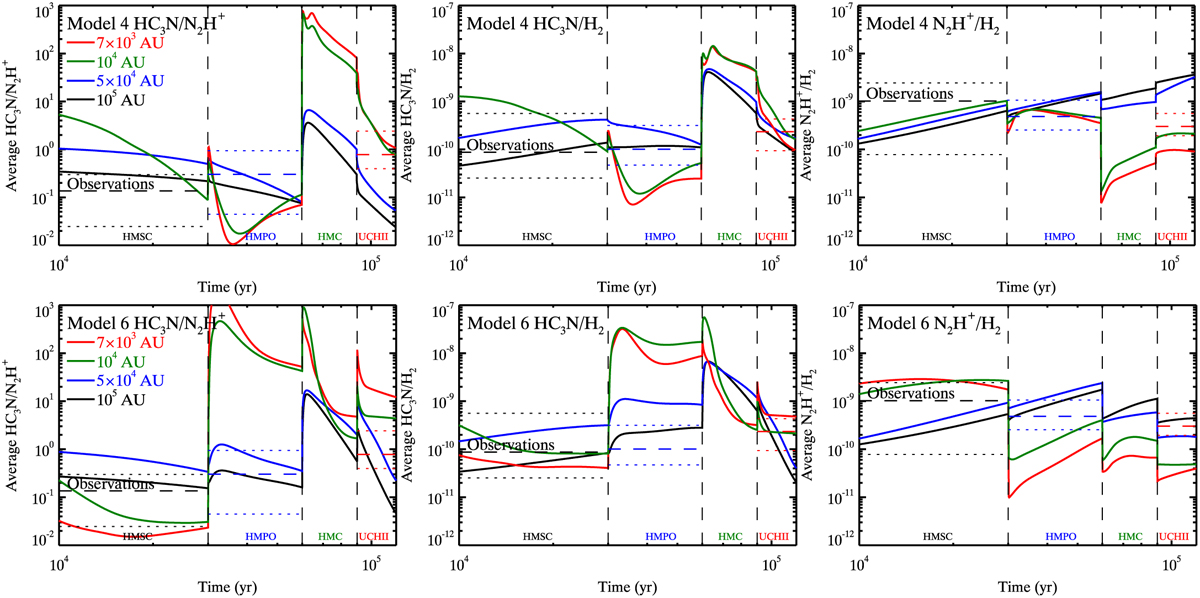
Time-dependent evolution of the average ratio of HC3N/N2H+ and the average fractional abundance of HC3N and N2H+ with respect to H2 within four different ranges (7 × 10³ AU, 104 AU, 5 × 10⁴ AU, and 105 AU) around the center using model 4 (left panels) and model 6 (right panels). The four evolutionary stages are labeled in each panel, and the observations are also plotted, with the dashed lines as the median values and the dotted lines as the maximums or minimums of observations. The evolution before 104 yr is excluded to show the changes in different stages more clearly. The results within 7 × 10³ AU and 104 AU during the HMSC stage in model 4 completely overlap because of the large rin > 104 AU.
Current usage metrics show cumulative count of Article Views (full-text article views including HTML views, PDF and ePub downloads, according to the available data) and Abstracts Views on Vision4Press platform.
Data correspond to usage on the plateform after 2015. The current usage metrics is available 48-96 hours after online publication and is updated daily on week days.
Initial download of the metrics may take a while.