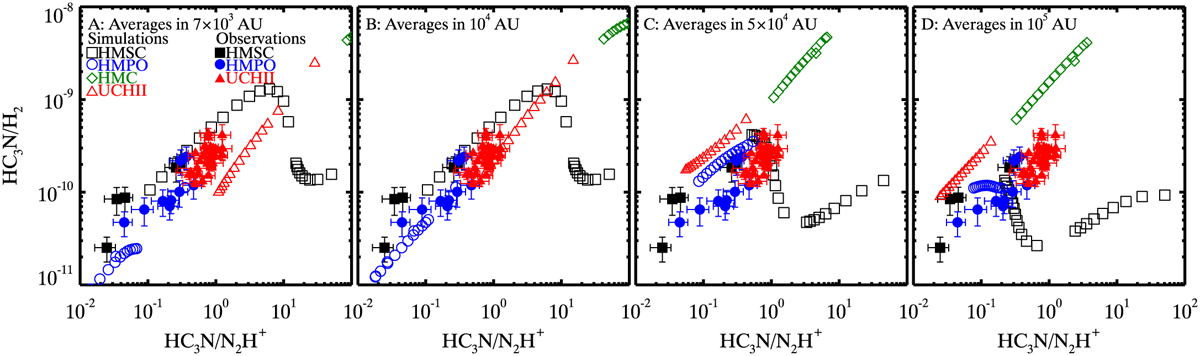
Fig. 1
Download original image
Correlation between the average ratio of HC3N/N2H+ and the average abundance of HC3N with respect to H2 within four different ranges (panel A: 7 × 10³ AU, panel B: 104 AU, panel C: 5 × 10⁴ AU, and panel D: 105 AU) around the center by adopting model 4 in chemical simulations compared with observations. The results during the HMSC, HMPO, HMC, and UCHII stages are plotted as squares, circles, diamonds, and triangles, respectively. The evolution of HC3N/N2H+ and HC3N/H2 throughout ttotal during each stage consistently decrease (from right to left and from top to bottom). The observations proposed by Taniguchi et al. (2019b) and Wang et al. (2023, including derived column density of HC3N, N2H+, and H2 simultaneously) are plotted as solid squares, solid circles, and solid triangles, respectively, with error bars.
Current usage metrics show cumulative count of Article Views (full-text article views including HTML views, PDF and ePub downloads, according to the available data) and Abstracts Views on Vision4Press platform.
Data correspond to usage on the plateform after 2015. The current usage metrics is available 48-96 hours after online publication and is updated daily on week days.
Initial download of the metrics may take a while.