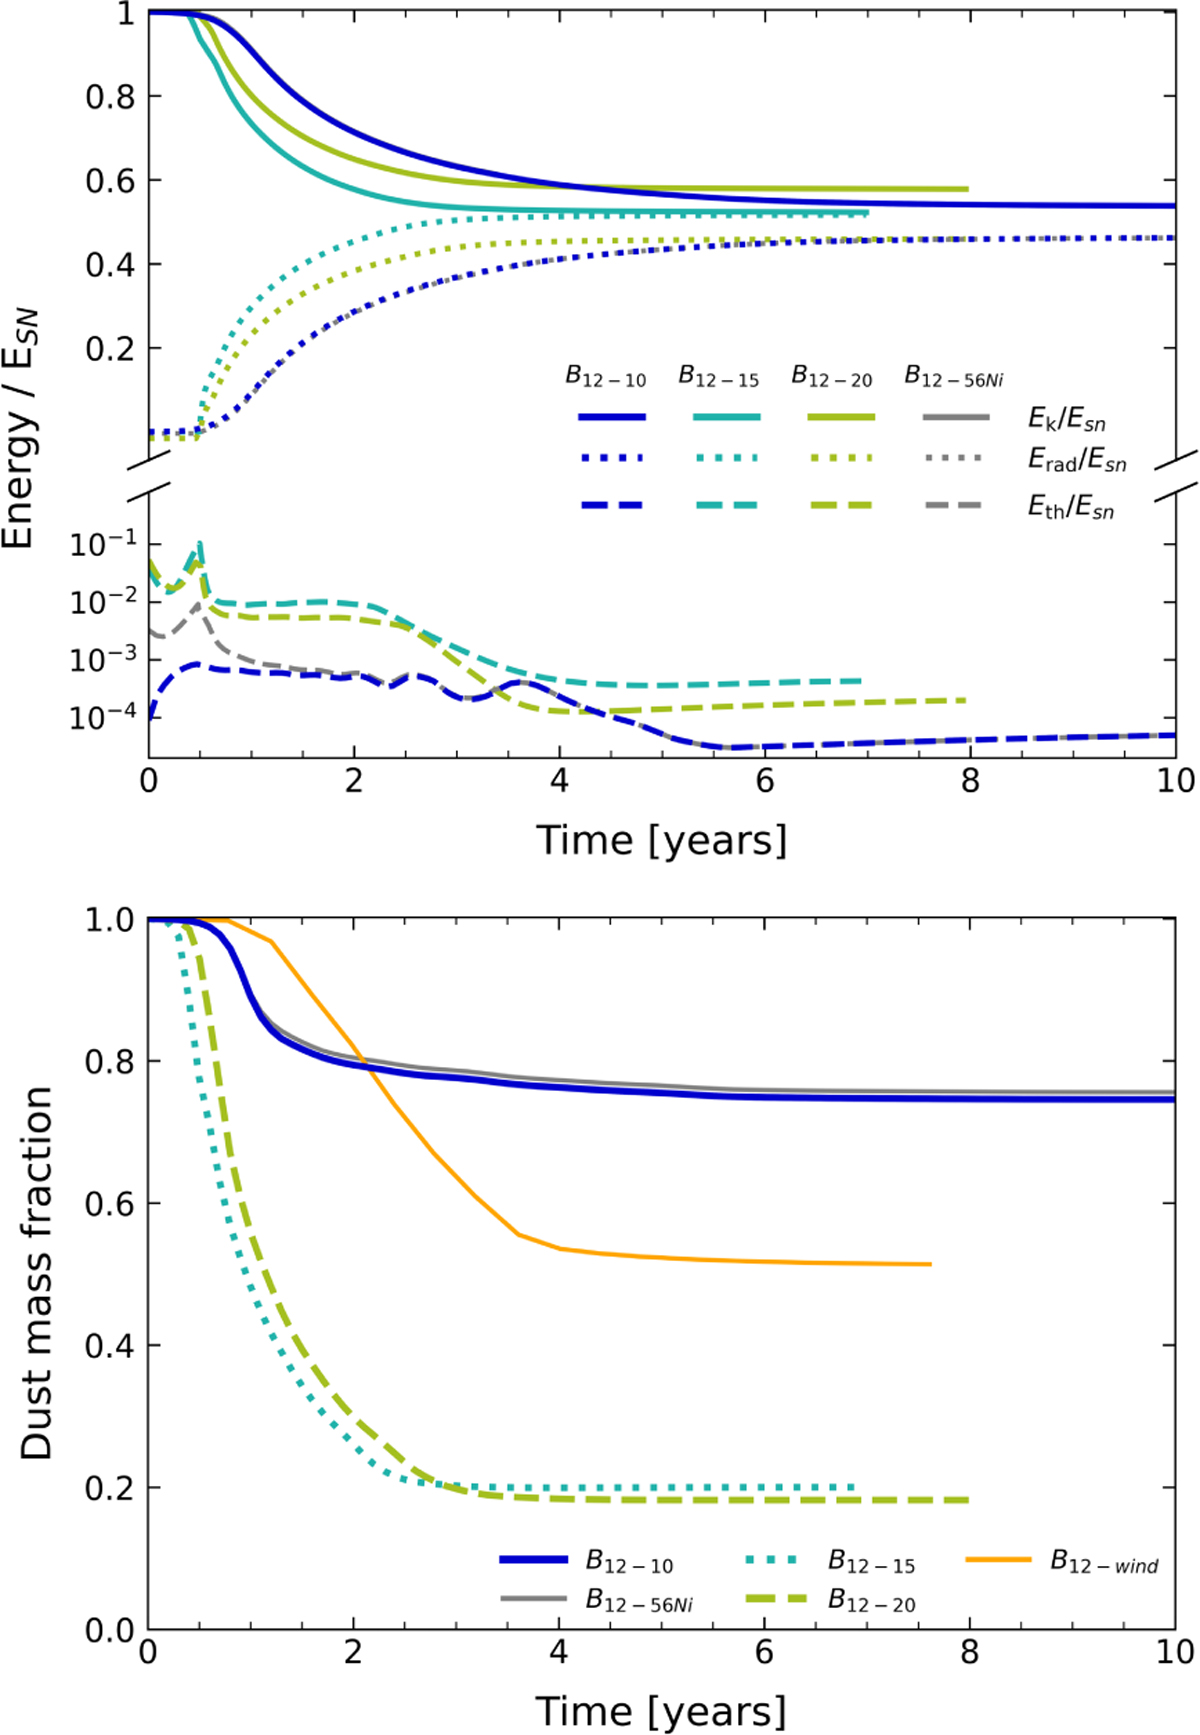
Fig. 8
Download original image
Same as Fig. 5 but for B12−10,B12−56Ni, B12−15, B12−20, and B12−wind (see Appendix C). Note that while the curves corresponding to cases B12−10 and B12−56Ni are presented up to 10 years post-SN, the ones corresponding to B12−15, B12−20, and B12−wind are presented only up to 7–8 years, as the simulations have reached the boundaries of the computational domain, but the most relevant phase of their evolution has already taken place.
Current usage metrics show cumulative count of Article Views (full-text article views including HTML views, PDF and ePub downloads, according to the available data) and Abstracts Views on Vision4Press platform.
Data correspond to usage on the plateform after 2015. The current usage metrics is available 48-96 hours after online publication and is updated daily on week days.
Initial download of the metrics may take a while.