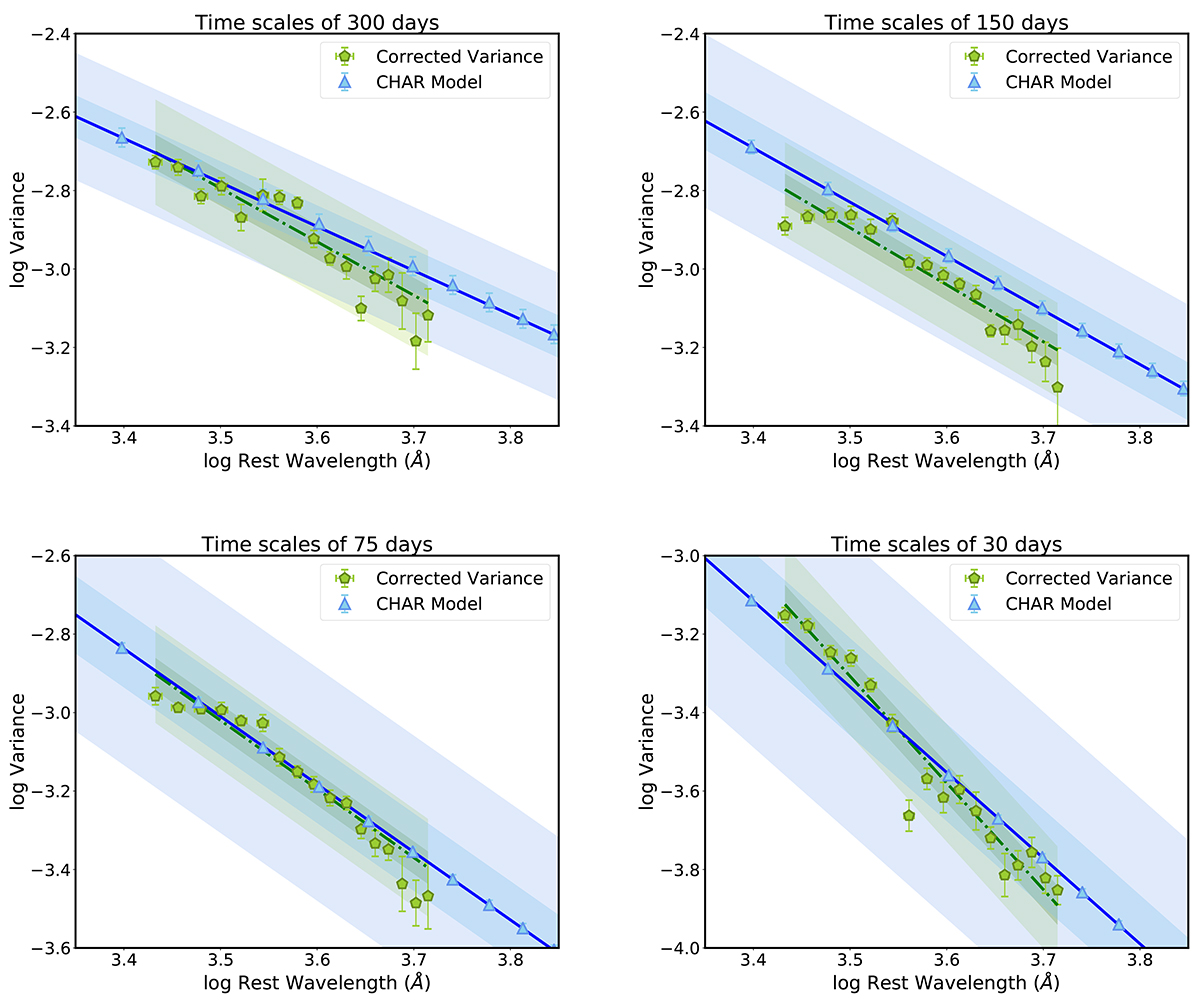
Fig. 5.
Download original image
Comparison of variance vs. rest-frame wavelength for ZTF data and CHAR model predictions for four different timescales. The observed median variance is shown with green pentagons, with error bars indicating the root-mean-squared scatter. The linear fit to the observed median variances is shown, while the green shaded areas represent 1σ and 3σ uncertainties, respectively. The mean CHAR model variance estimated for the corresponding 128 simulated rest-frame wavelength light curves is shown with blue triangles, with error bars representing the standard error of the mean. The linear fit to the mean model variances is shown with the solid blue line. The shaded regions in blue indicate the 1σ and 3σ uncertainties, respectively.
Current usage metrics show cumulative count of Article Views (full-text article views including HTML views, PDF and ePub downloads, according to the available data) and Abstracts Views on Vision4Press platform.
Data correspond to usage on the plateform after 2015. The current usage metrics is available 48-96 hours after online publication and is updated daily on week days.
Initial download of the metrics may take a while.