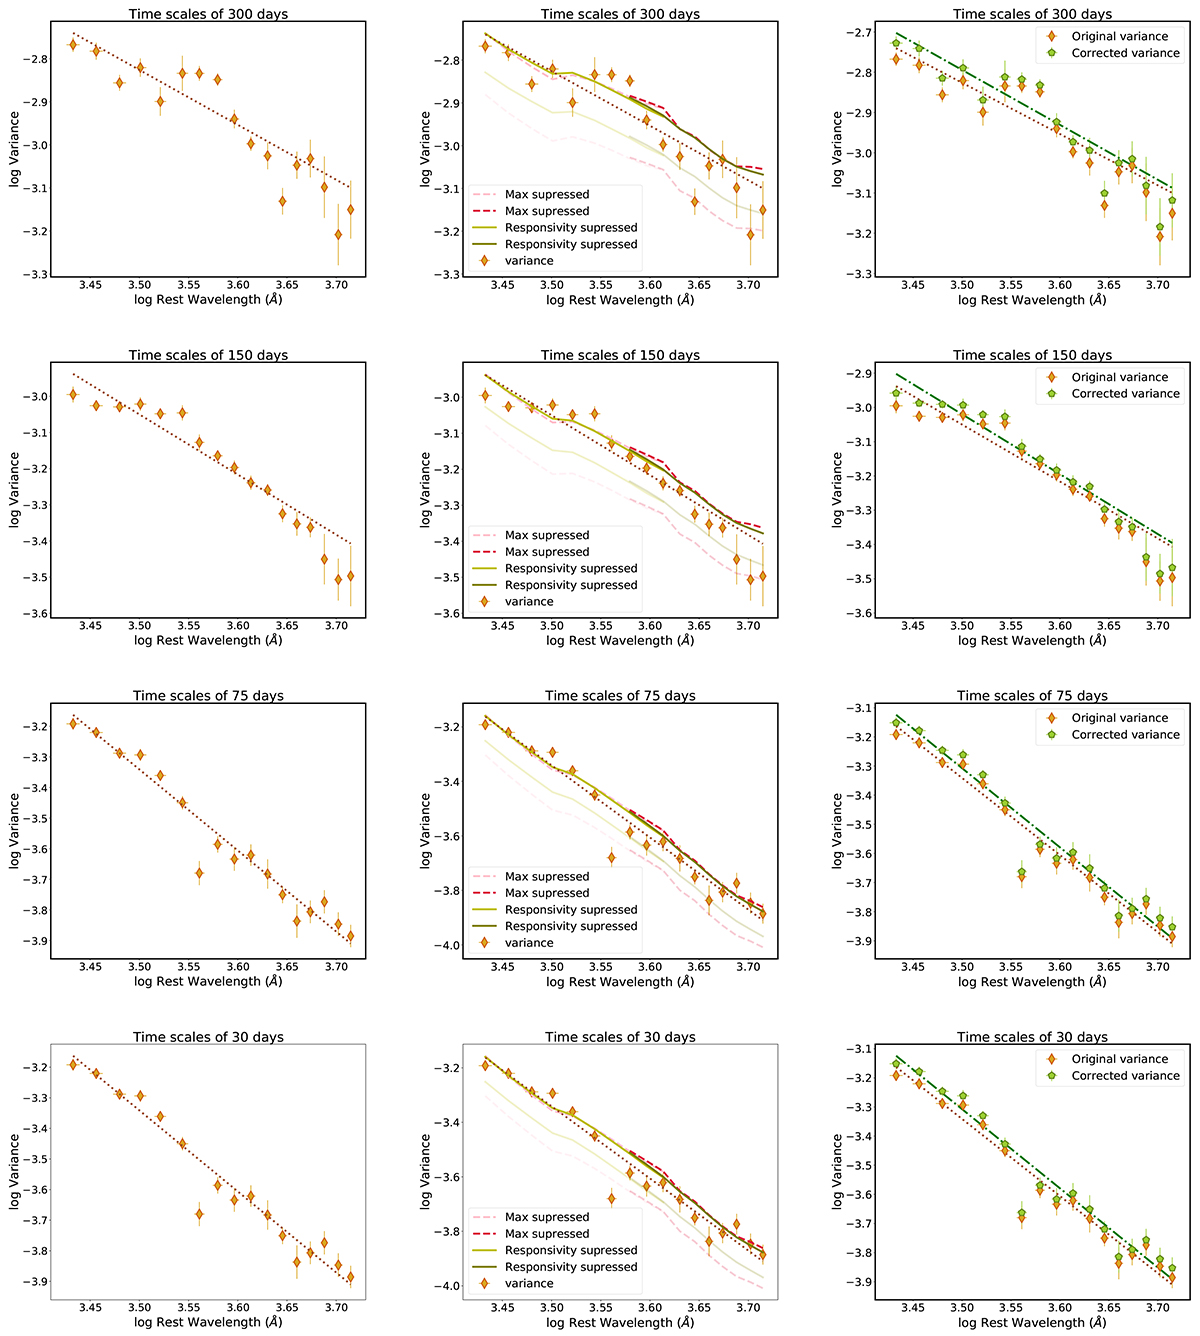
Fig. 3.
Download original image
Variance vs. rest-frame wavelength for four variability timescales. Each row represents a specific timescale of 300, 150, 75, or 30 days. Left column: original variance and linear fits. Steeper negative correlations are seen for shorter timescale fluctuations (notice the different dynamical range of the y axis). Middle column: original variance and linear fits including spectral corrections due to variance suppression caused by emission lines and Balmer and Fe pseudo-continua. Suppression was obtained assuming that emission lines and pseudo-continua are not variable at all or show partial variability given by their responsivities (Kokubo et al. 2014), as shown in the legend. Lighter lines show the full spectral suppression while darker lines show the suppression after and arbitrary vertical shift is applied. Right column: original (gold diamonds) and new variance values (green pentagons) after adding the suppressed variance as determined using line and pseudo-continua responsivities, including original and new linear fits. See Section 4 for details on the spectral suppression correction.
Current usage metrics show cumulative count of Article Views (full-text article views including HTML views, PDF and ePub downloads, according to the available data) and Abstracts Views on Vision4Press platform.
Data correspond to usage on the plateform after 2015. The current usage metrics is available 48-96 hours after online publication and is updated daily on week days.
Initial download of the metrics may take a while.