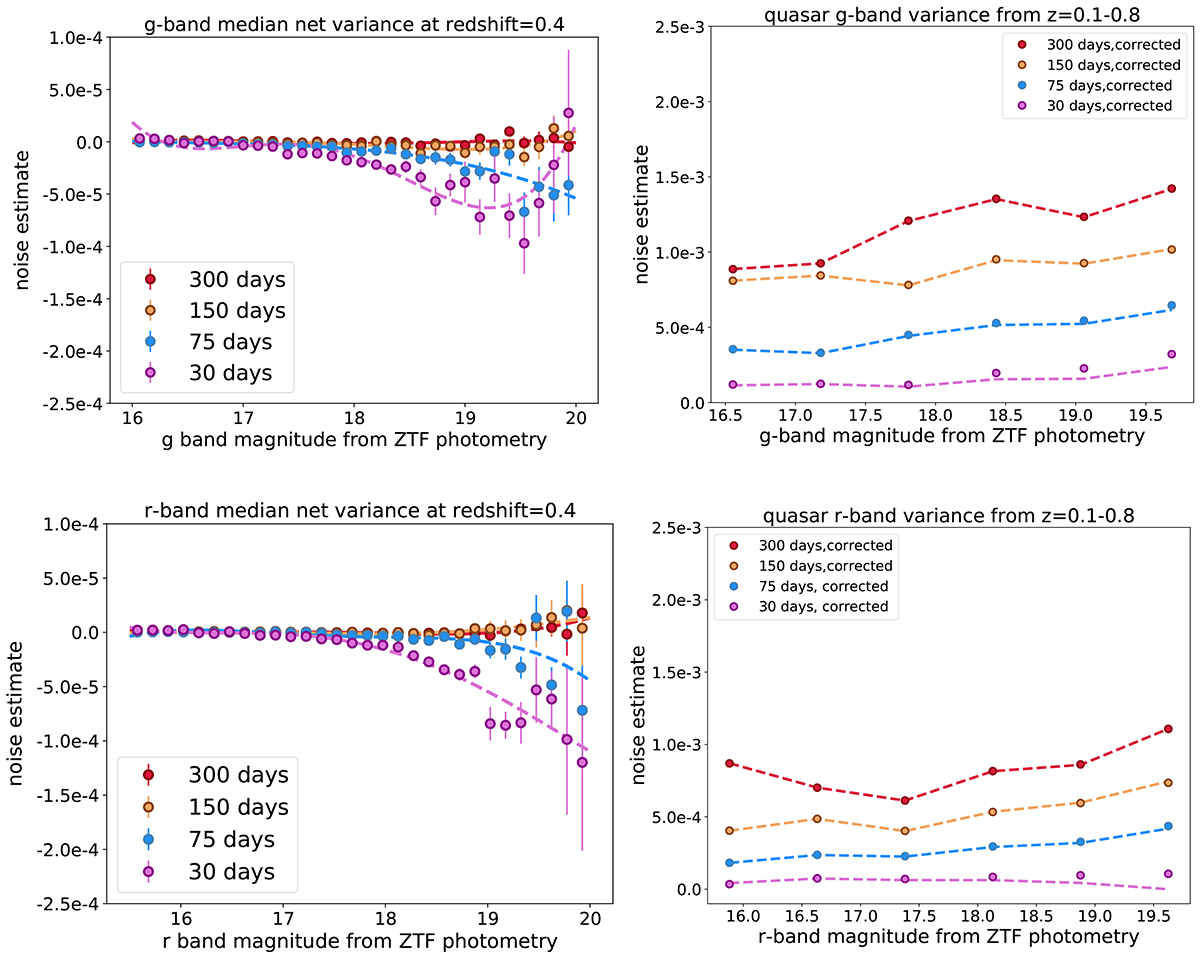
Fig. 2.
Download original image
Correction in the variance for the g and r bands. Left: net variance (total variance – noise estimate) of the standard stars as a function of ZTF magnitude for four different timescales at redshift bin 0.4, as is shown in the legend. The markers show the median net variances for each bin in magnitude, and the polynomial fits are shown as dashed lines. The error bars representing the median variance of the binned data were determined through a bootstrapping approach using 1000 re-samples within each magnitude bin and computing the root-mean-squared scatter of the medians. Right: median net quasar variances, shown with dashed lines, as a function of ZTF magnitude for four different timescales at redshifts 0.1 − 0.8. Upon implementing the noise estimate correction, the median variances exhibit a shift from the values indicated by the lines to those represented by the solid markers (circles).
Current usage metrics show cumulative count of Article Views (full-text article views including HTML views, PDF and ePub downloads, according to the available data) and Abstracts Views on Vision4Press platform.
Data correspond to usage on the plateform after 2015. The current usage metrics is available 48-96 hours after online publication and is updated daily on week days.
Initial download of the metrics may take a while.