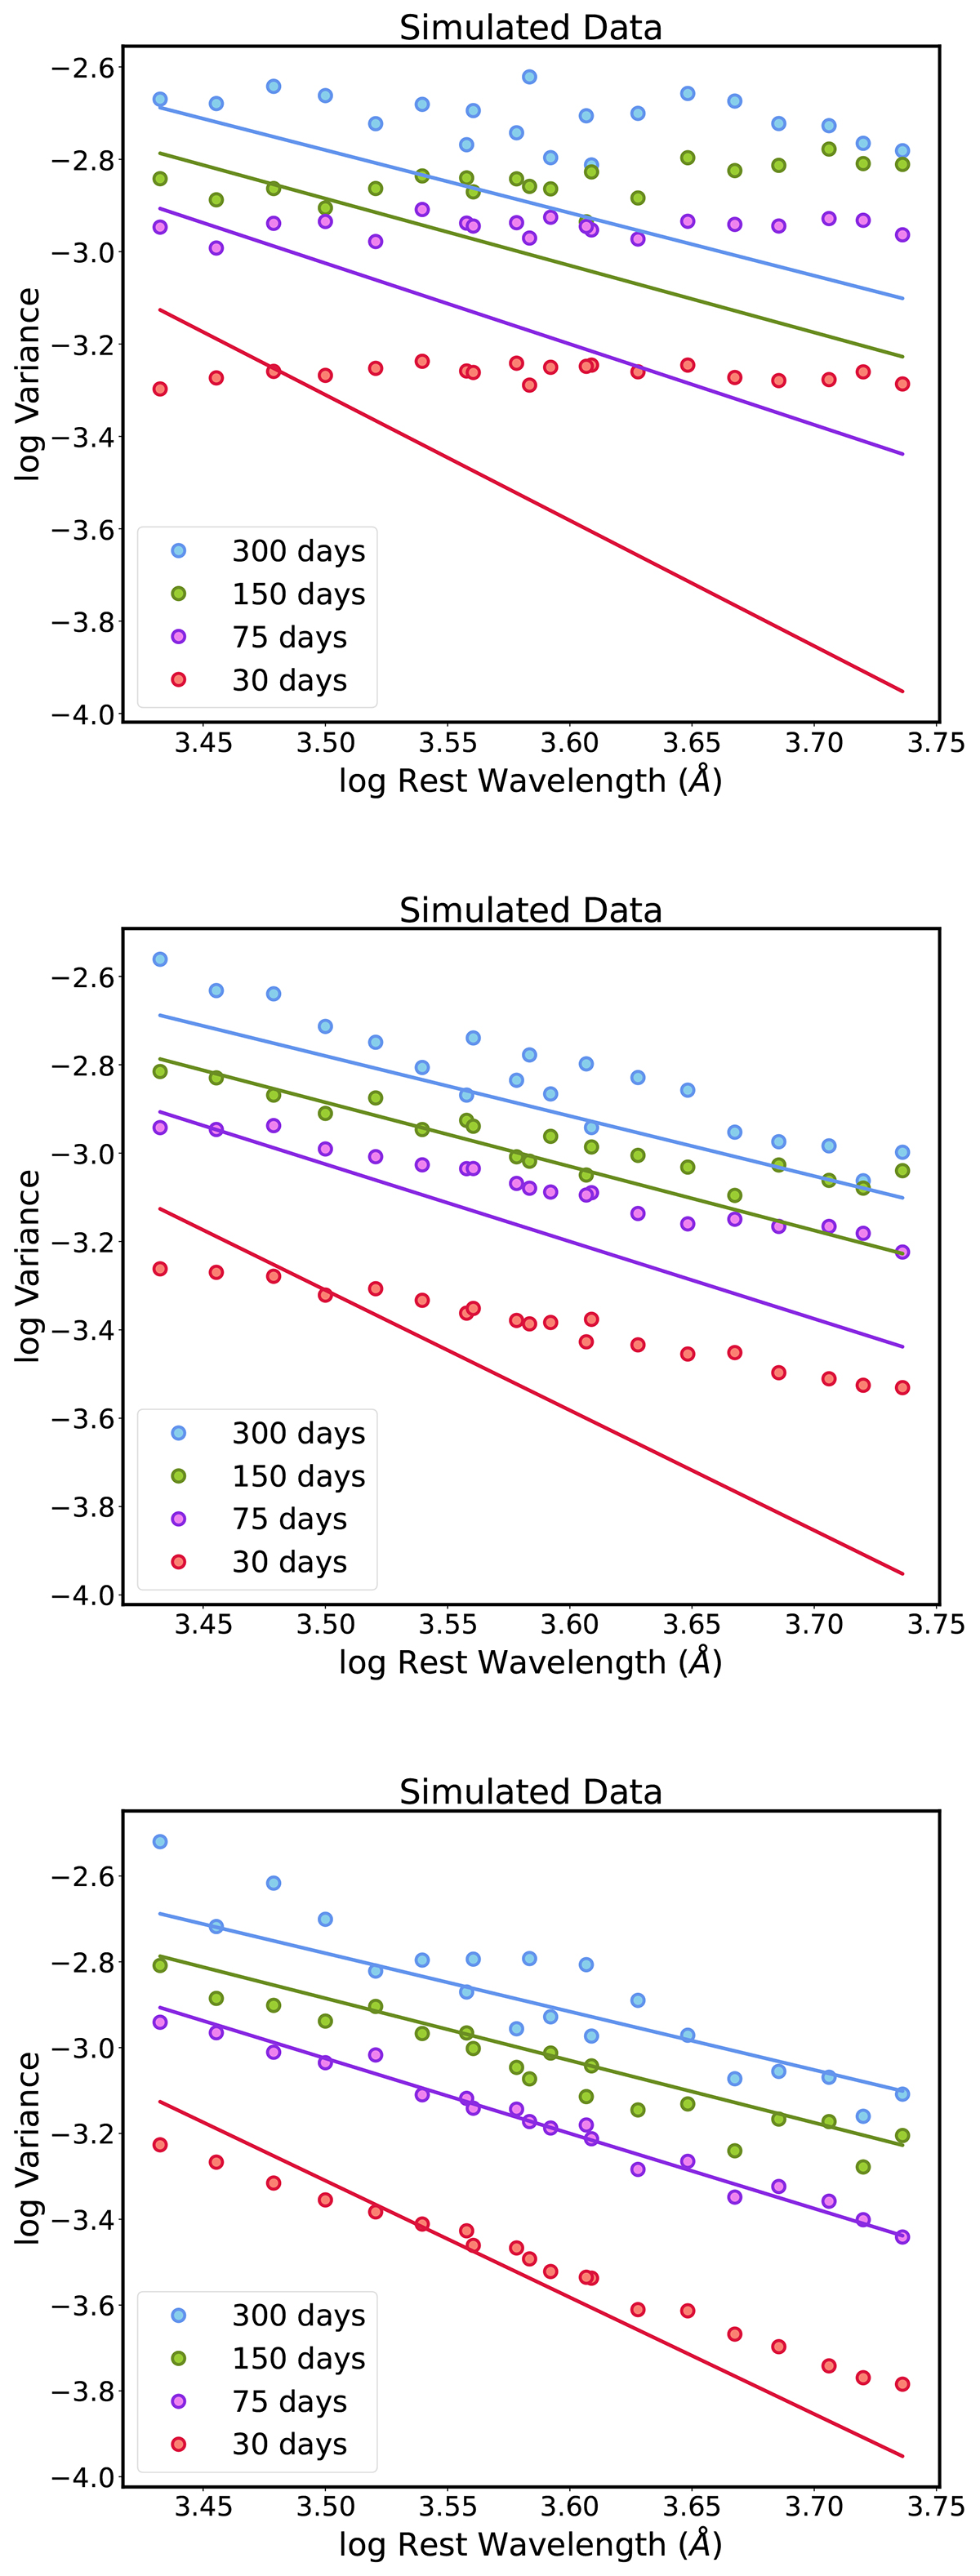
Fig. E.1.
Download original image
ZTF Data-Simulation Comparison. This figure compares ZTF data with simulations from the bending power law model for variance versus rest-frame wavelength at four different timescales: 300, 150, 75, and 30 days. The circles represent the mean variance from simulations, while the solid lines show the linear fit to the ZTF data. The first subplot (left) shows results assuming no wavelength dependence of the power spectrum or its normalization. The second subplot (middle) includes wavelength dependence only in the normalization of the power spectrum. The third subplot (right) incorporates wavelength dependence in both the normalization and the break frequency. Despite these adjustments, the model does not fully account for the steepening at 30 days, indicating that additional factors, such as a wavelength-dependent slope in the power spectrum, might be needed to explain the observed trends.
Current usage metrics show cumulative count of Article Views (full-text article views including HTML views, PDF and ePub downloads, according to the available data) and Abstracts Views on Vision4Press platform.
Data correspond to usage on the plateform after 2015. The current usage metrics is available 48-96 hours after online publication and is updated daily on week days.
Initial download of the metrics may take a while.