Open Access
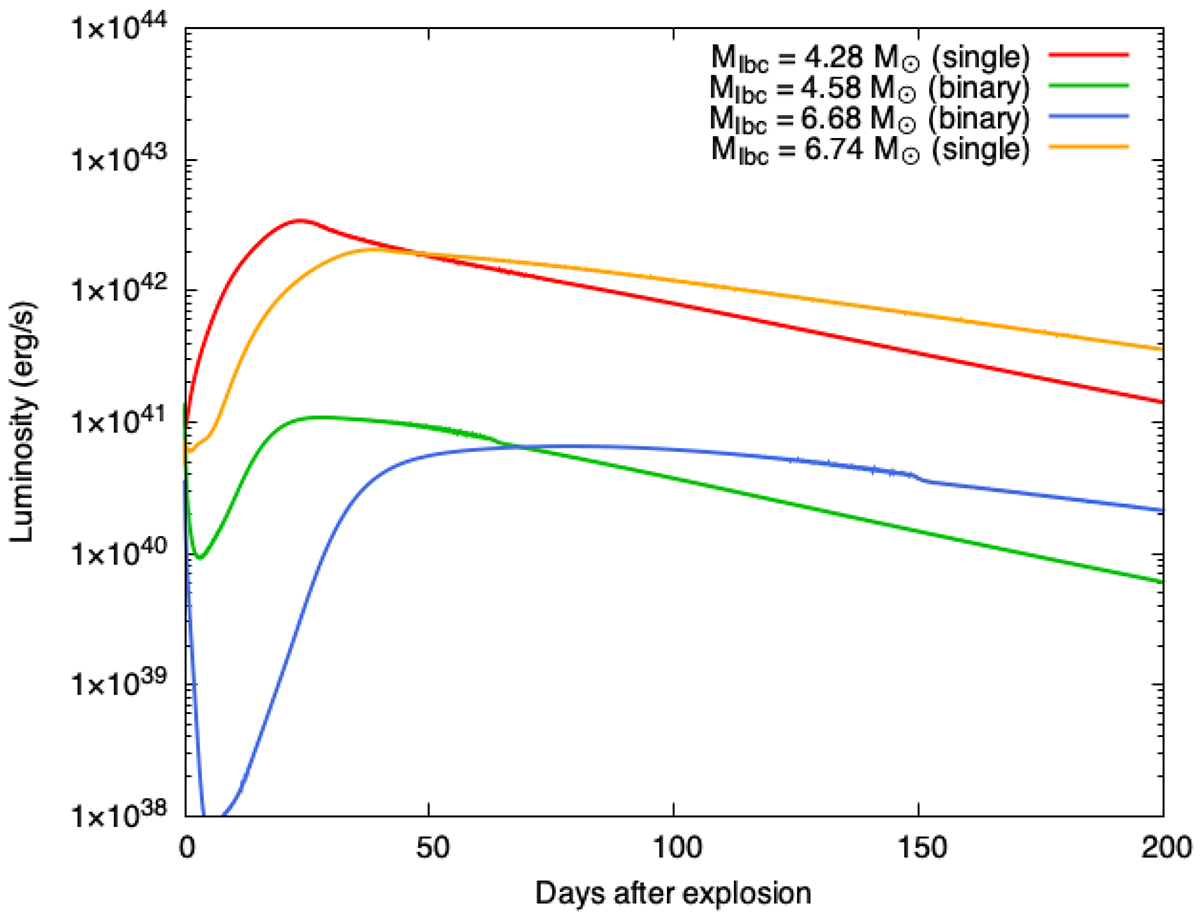
Fig. 4.
Download original image
Comparison of single-star and binary models with a similar progenitor mass. The red and orange lines represent single-star models with 4.28 and 6.74 M⊙, and green and blue lines show binary calculations with 4.58 and 6.68 M⊙, respectively.
Current usage metrics show cumulative count of Article Views (full-text article views including HTML views, PDF and ePub downloads, according to the available data) and Abstracts Views on Vision4Press platform.
Data correspond to usage on the plateform after 2015. The current usage metrics is available 48-96 hours after online publication and is updated daily on week days.
Initial download of the metrics may take a while.