Open Access
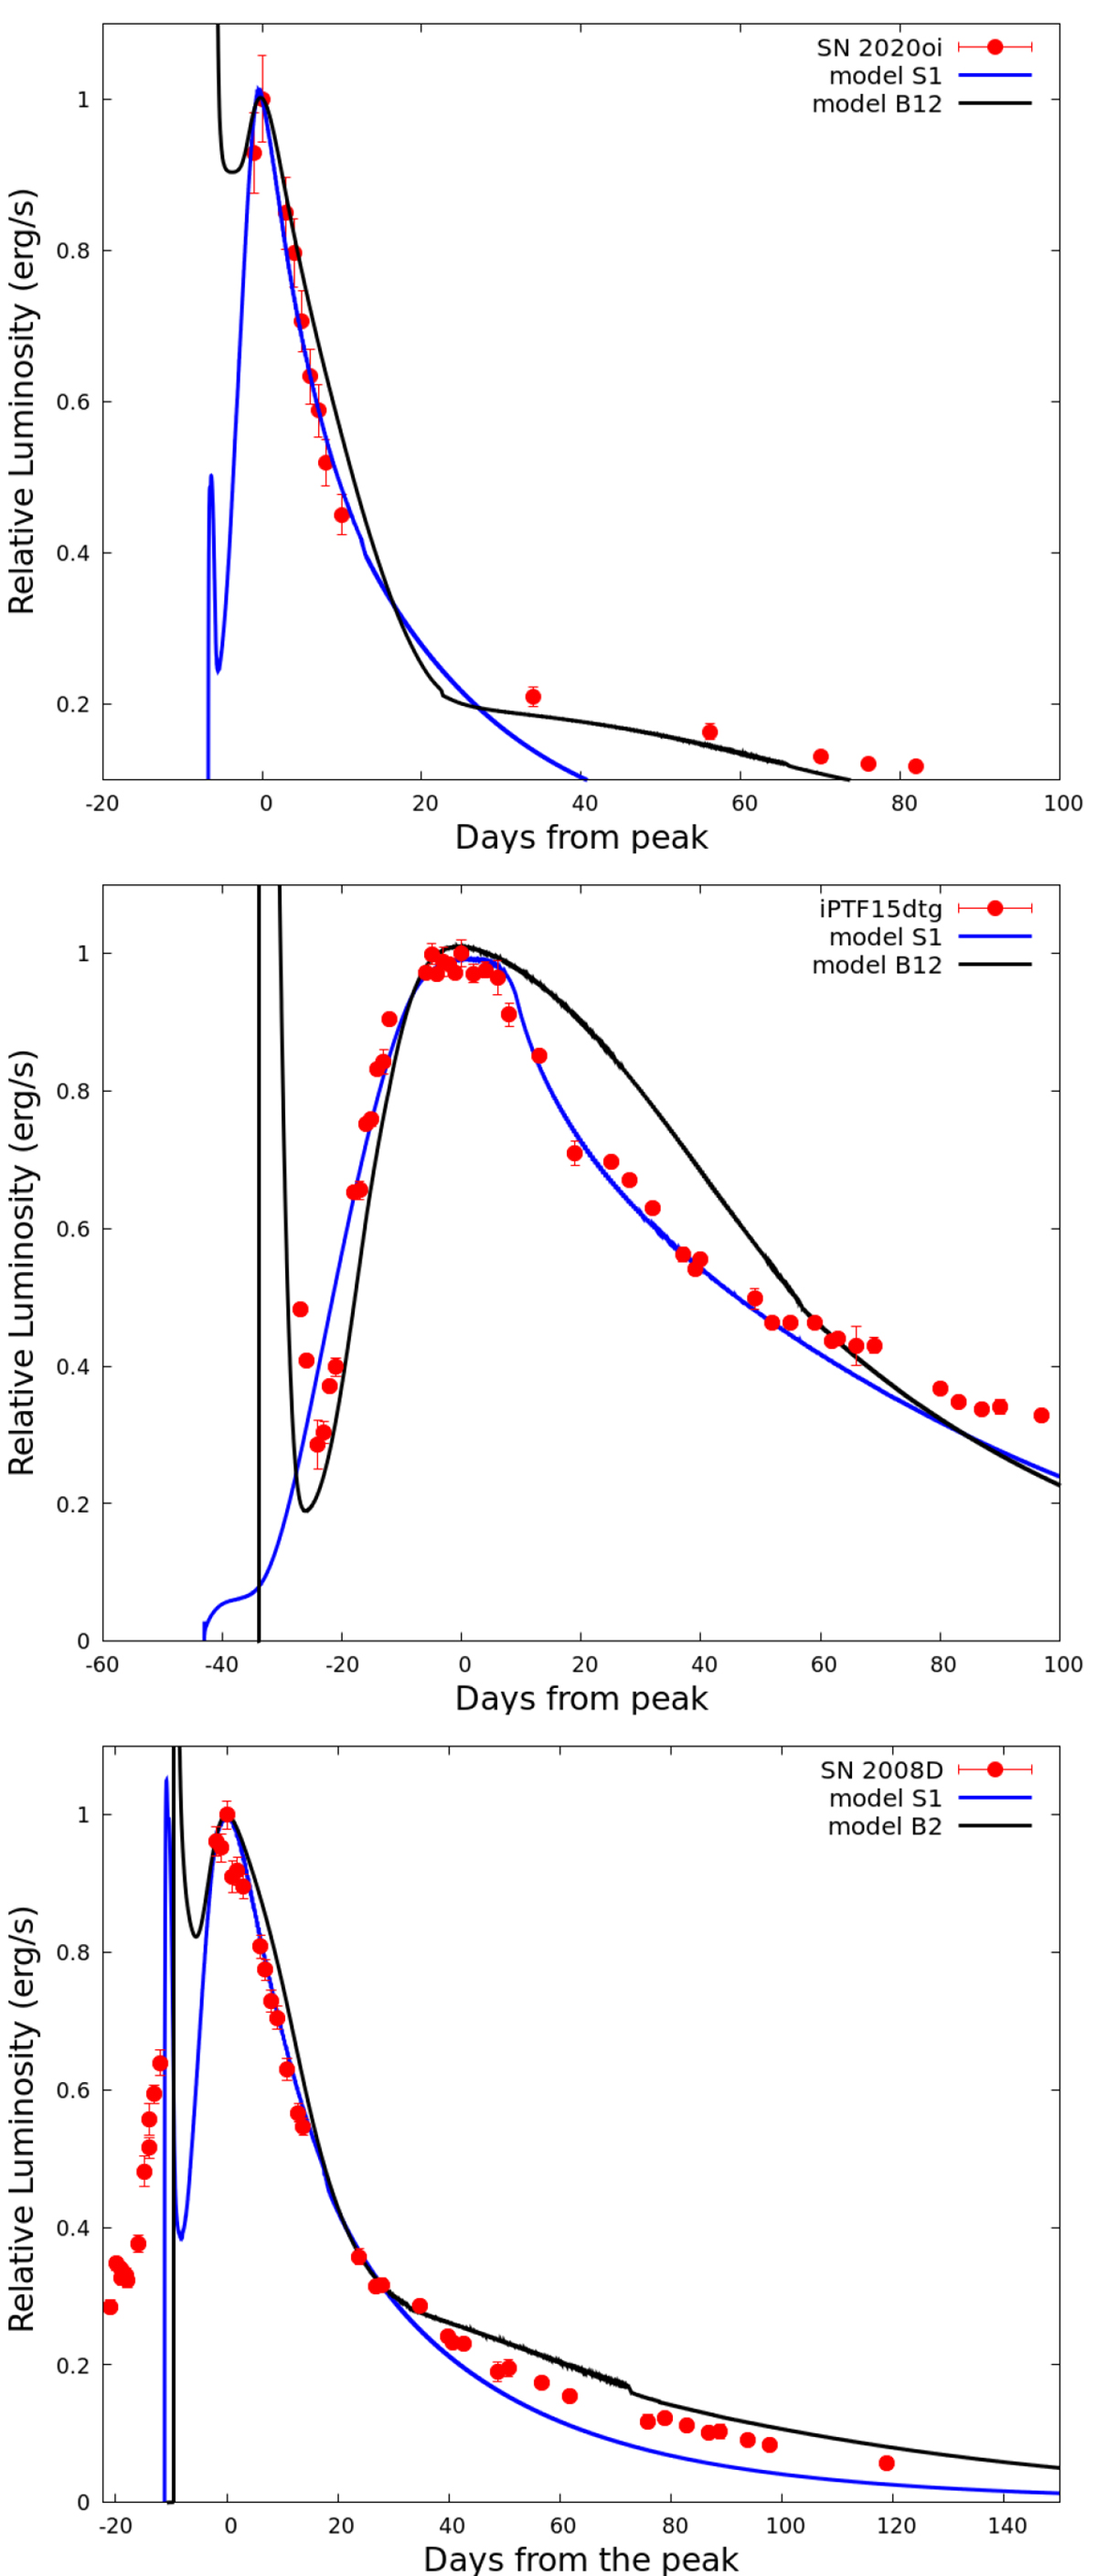
Fig. 10.
Download original image
Comparison of an interacting single-star (blue line) and an interacting binary (black line) model with the bolometric light curve (red circles) of SN 2020oi (top panel), iPTF15dtg (middle panel), and SN 200D (bottom panel), respectively.
Current usage metrics show cumulative count of Article Views (full-text article views including HTML views, PDF and ePub downloads, according to the available data) and Abstracts Views on Vision4Press platform.
Data correspond to usage on the plateform after 2015. The current usage metrics is available 48-96 hours after online publication and is updated daily on week days.
Initial download of the metrics may take a while.