Fig. A.2.
Download original image
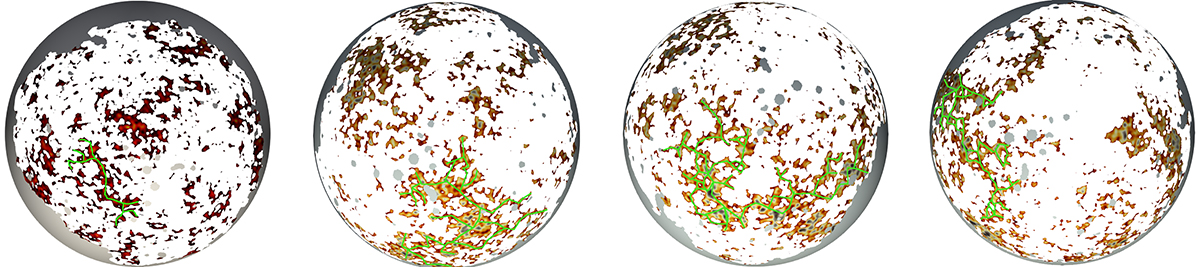
A visualization of the structure of the superlevel set of the temperature field at the threshold ν = 0.5 for the northern hemisphere. This is the threshold at which we detect a statistically significant deviation between the observation and simulations in the number of isolated components. The top-left panel presents the visualization of the observed CMB map from PR3 data release. The rest of the panels present the visualization for the randomly selected simulation sample from the FFP10 simulation set, numbering 42, and its two higher multiples 84 and 126. All the maps are smoothed with a Gaussian beam profile of FWHM = 80′. At the level of visual examination, we find that the observational map is composed of larger number of smaller structures compared to the simulations, which display the evidence of larger structures. The largest connected structure in the observational and simulated maps are traced by green connected segments for reference. It is evident that the simulations are characterized by larger such structures compared to the observational map.
Current usage metrics show cumulative count of Article Views (full-text article views including HTML views, PDF and ePub downloads, according to the available data) and Abstracts Views on Vision4Press platform.
Data correspond to usage on the plateform after 2015. The current usage metrics is available 48-96 hours after online publication and is updated daily on week days.
Initial download of the metrics may take a while.