Fig. 4.
Download original image
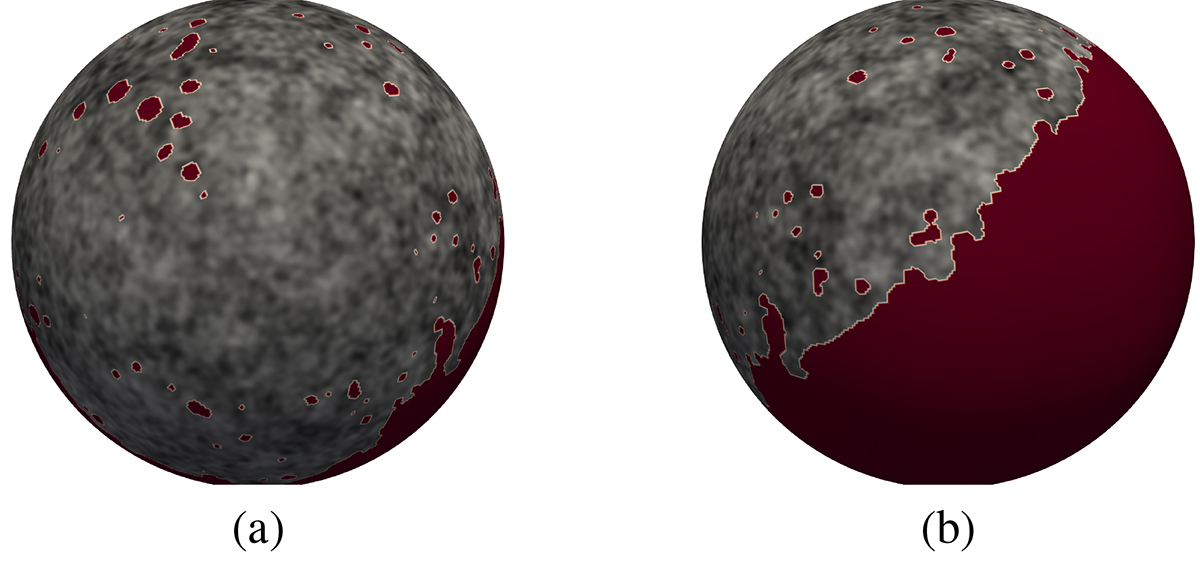
Visualization of the CMB temperature fluctuation field in the northern hemisphere in two different views. The masked area covers the whole southern hemisphere and the relevant parts of the northern hemisphere, dictated by the PR3 temperature common mask. The visualization is based on the PR3 observed map, cleaned using the SMICA component separation pipeline, degraded at N = 128 and smoothed with a Gaussian kernel of FWHM = 80′.
Current usage metrics show cumulative count of Article Views (full-text article views including HTML views, PDF and ePub downloads, according to the available data) and Abstracts Views on Vision4Press platform.
Data correspond to usage on the plateform after 2015. The current usage metrics is available 48-96 hours after online publication and is updated daily on week days.
Initial download of the metrics may take a while.