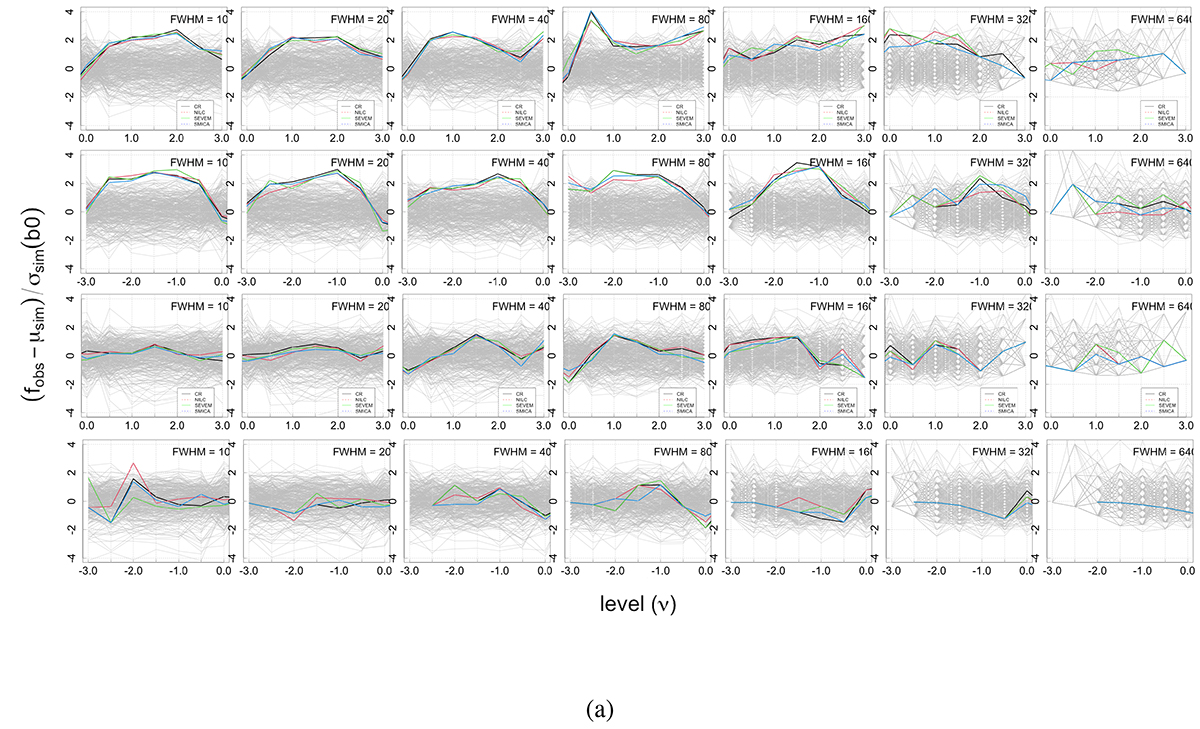
Fig. B.3.
Download original image
Graphs for local normalization. Graphs of b0 and b1 for the temperature maps for the PR3 dataset for the northern (top two rows) and the southern hemisphere (bottom two rows)The variance is computed for each hemisphere separately from the unmasked pixels in that hemisphere. The graphs present the normalized differences, and each panel presents the graphs for a range of degradation and smoothing scales. The mask used is the PR3 temperature common mask.
Current usage metrics show cumulative count of Article Views (full-text article views including HTML views, PDF and ePub downloads, according to the available data) and Abstracts Views on Vision4Press platform.
Data correspond to usage on the plateform after 2015. The current usage metrics is available 48-96 hours after online publication and is updated daily on week days.
Initial download of the metrics may take a while.