Fig. 8
Download original image
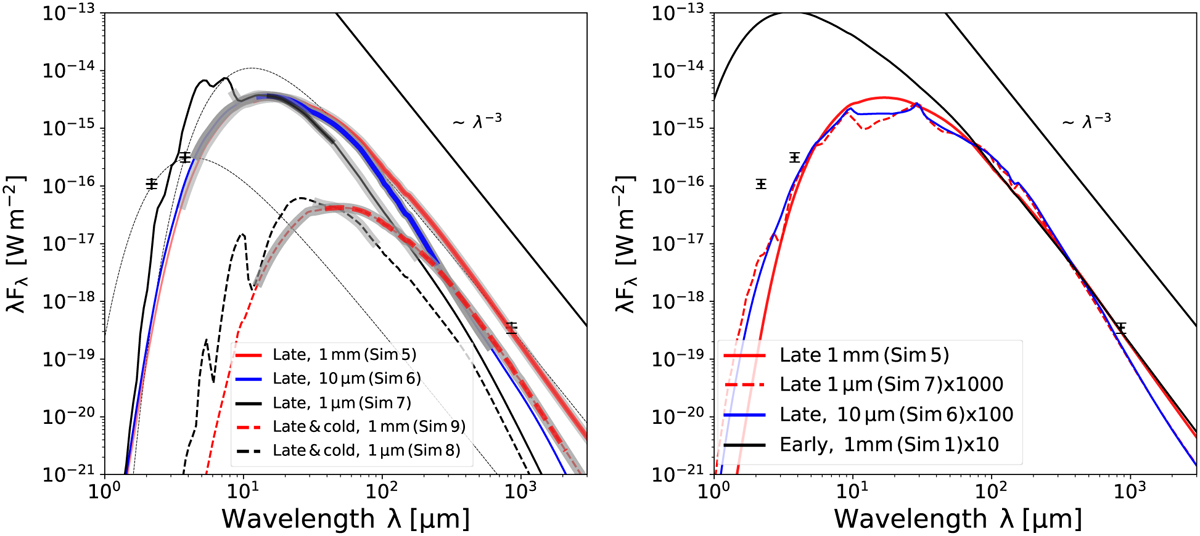
Spectral shapes of simulations with nominal and increased dust masses. Left: late models with a ×100 times increased dust mass show significantly increased CPD fractions in their spectra (solid lines), due to the formation of emission surfaces in the CPD. We keep the previously introduced black-bodies for very rough expectations on the planet and CPD emissions. FIR slopes are again black-body-like for millimetre-sized particles, while the overall steepness is not as dramatic as for the early-type small particles, making a fit more difficult. However, the width of the PDS 70c data can be approximately fitted when considering larger grains. The artificially cooled down envelopes (dashed lines) are too cool to fit the observations and particularly undershoot the ALMA measurement. Right: degeneracy check for the fits on the left. We attempted verify whether increases in dust mass of smaller particles can also fit the seen width, which we can confirm here. Hence more data is needed to distinguish between mass and particle size. Curves are plotted without the indicators for the CPD fraction, as the viable fits all are optically thick in the CPD region and hence the sub-millimetre signal is actually emitted by the CPD.
Current usage metrics show cumulative count of Article Views (full-text article views including HTML views, PDF and ePub downloads, according to the available data) and Abstracts Views on Vision4Press platform.
Data correspond to usage on the plateform after 2015. The current usage metrics is available 48-96 hours after online publication and is updated daily on week days.
Initial download of the metrics may take a while.