Fig. 7
Download original image
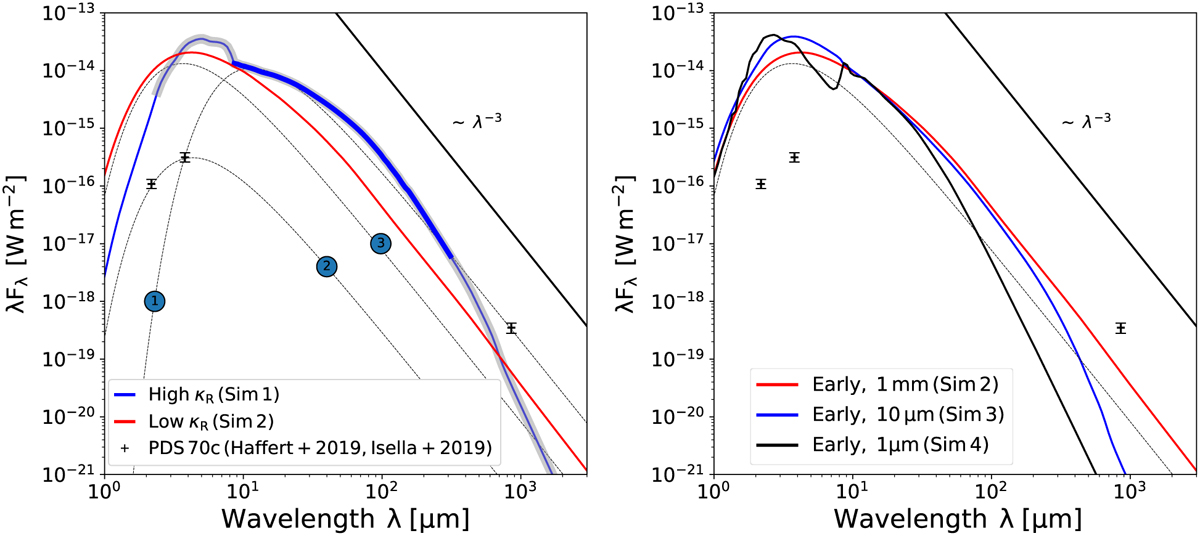
Comparison of the spectral shape in the two main hydro simulations and studying the effects of dust growth. Left: spectral energy distributions for sims 1 and 2 with all dust species included and normalized to the distance of PDS 70, 113 pc. Furthermore, we plot the fluxes for PDS 70c in the Ks (2.18 μm), L′ (3.8 μm) and 855 μm bands reported by Haffert et al. (2019); Isella et al. (2019). For conversion details and flux errors, see Appendix A. The observational data as well as our model spectra are compared in width to black-bodies (BB), plotted as thin, dashed curves. There are BB (1) (T = 300 K), BB (2) (T = 850 K) and BB (3) (T = 1000 K). PDS 70c fails to be modelled by BBs (1) or (2) and due to this width, it reveals to possess a CPD component. Our model data compared with BB (3) shows it to have multiple BB contributions. Grey shading indicates a weak CPD contribution, i.e. FCPD > 0.1FPlanet and thick lines indicate a dominant CPD contribution, i.e. FCPD > FPlanet- Right: spectra for the low κR-simulations, emphasizing the effect of dust growth on the spectra. To keep the optical depth constant for the smaller dust particles with higher opacities, we adjusted fDG downwards accordingly. For all wavelengths, the CPD is transparent and the emission surfaces are convex features that are situated around the planet, similar to the olivine-only case in Fig. 6 (left). The comparison of spectral width to the black-body (dotted black line) shows that for the millimetre-particle case, the spectrum is a convolution of black-bodies over the 3D structure, while the origin of the width is less clear for the smaller particles. Furthermore, the growth from ISM-like towards millimetre-sized particles 1) greys the spectrum and 2) produces a FIR-tail that is significantly shallower than the expectation from single-temperature, single-small-particles, which would be a ~λ−5-slope.
Current usage metrics show cumulative count of Article Views (full-text article views including HTML views, PDF and ePub downloads, according to the available data) and Abstracts Views on Vision4Press platform.
Data correspond to usage on the plateform after 2015. The current usage metrics is available 48-96 hours after online publication and is updated daily on week days.
Initial download of the metrics may take a while.