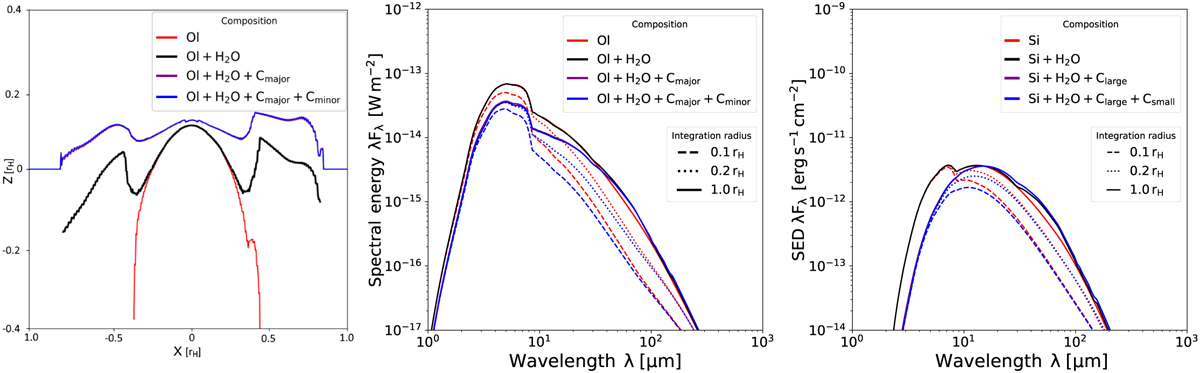
Fig. 6
Download original image
Detailed impact of including an increasing number of opacity carriers and radial integration regions onto the optically thick surface and the spectrum. Left and middle: effects of successively adding opacity carriers into sim 1. We show the emission surfaces in real space at 30 µm on the left, again integrated from z = +∞, with the radial distance on the x axis and the vertical distance on the z axis. The resulting full spectrum is shown on the right. The olivine (Ol) sets the dominant part of the spectrum, with the contribution from the water ice being minuscule mainly due to being outshone by the olivine close to the planet. Once the organics components are added (Cmajor and Cminor), the central emission surface is lifted up to colder temperatures (longer wavelengths), leading to a weaker signal in the NIR through extinction. Interestingly, the carbon greys out its own sublimation signature in the emission surface, whereas the sublimation line is clearly visible for water in the emission surface, but only weakly in the spectrum. When measuring the CPD contribution to the spectrum, we subtract everything outside of 0.1 rH from the simulation domain. This process can be seen on the right side, when following the dashed blue line as it changes into the dotted blue and then the solid blue line. It becomes evident that this spectrum, when all dust ingredients are included, gains a lot of flux for λ > 10 µm, while its gain is minor for λ < 10 µm. This leads to the conclusion that for λ > 10 µm this model is CPD-dominated. The same can be repeated for the olivine-only spectra. Those inform us that already the hot olivine blob seen on the left can be counted as CPD contribution. Right: same as on the left side, but for sim 6, deriving from the low κR-data, but having the same optical depth as sim 1 through a ×100 density increase. Water emission from the CPD plays a larger role in this spectrum, particularly between 30 µm and 100 µm.
Current usage metrics show cumulative count of Article Views (full-text article views including HTML views, PDF and ePub downloads, according to the available data) and Abstracts Views on Vision4Press platform.
Data correspond to usage on the plateform after 2015. The current usage metrics is available 48-96 hours after online publication and is updated daily on week days.
Initial download of the metrics may take a while.