Fig. 5
Download original image
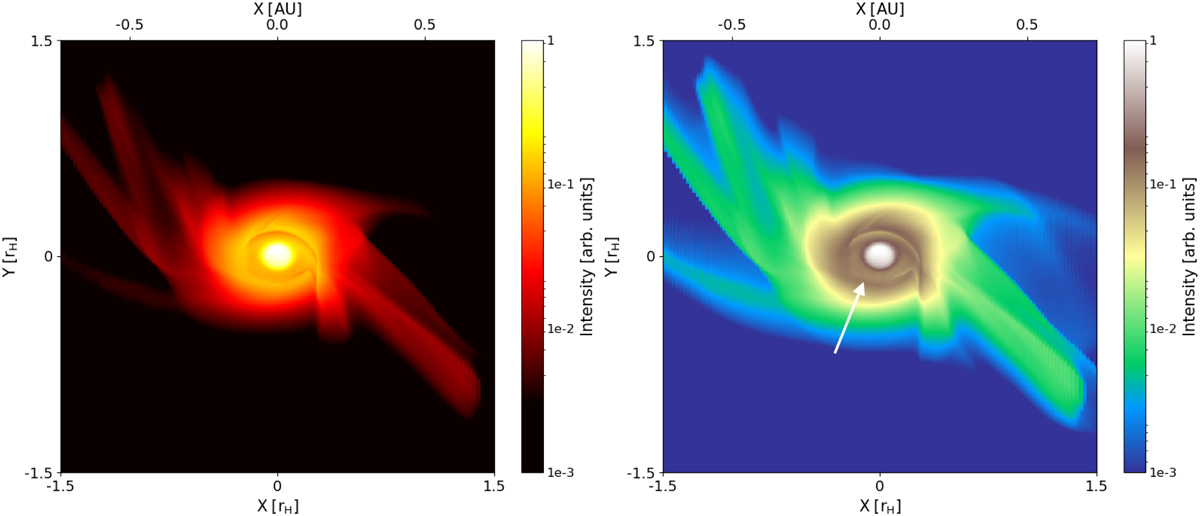
Synthetic intensity maps for the planet and CPD for sim 1 at 30 µm seen at 50° inclination, to mimic PDS 70c. Those maps assume a spatial resolution far superior to ALMA, but serve the purpose to illustrate the intensity contributions to the spectral flux at this wavelength. On the left we show a intuitive heat map, on the right with a more contrasted colour map. On the right, one can distinguish several regions according to their emission intensity I : Emission from the innermost planet, originating from olivine, I ≈ 1, the CPD with the water ice line I ≈ 0.1–0.6, also marked with the white arrows, the outer edge of the CPD I ≈ 0.03, various disc structures including spiral arms at I ≈ 0.01. The arrow marks the water ice sublimation line, which through its associated drop in opacity reveals some inner parts of the envelope.
Current usage metrics show cumulative count of Article Views (full-text article views including HTML views, PDF and ePub downloads, according to the available data) and Abstracts Views on Vision4Press platform.
Data correspond to usage on the plateform after 2015. The current usage metrics is available 48-96 hours after online publication and is updated daily on week days.
Initial download of the metrics may take a while.