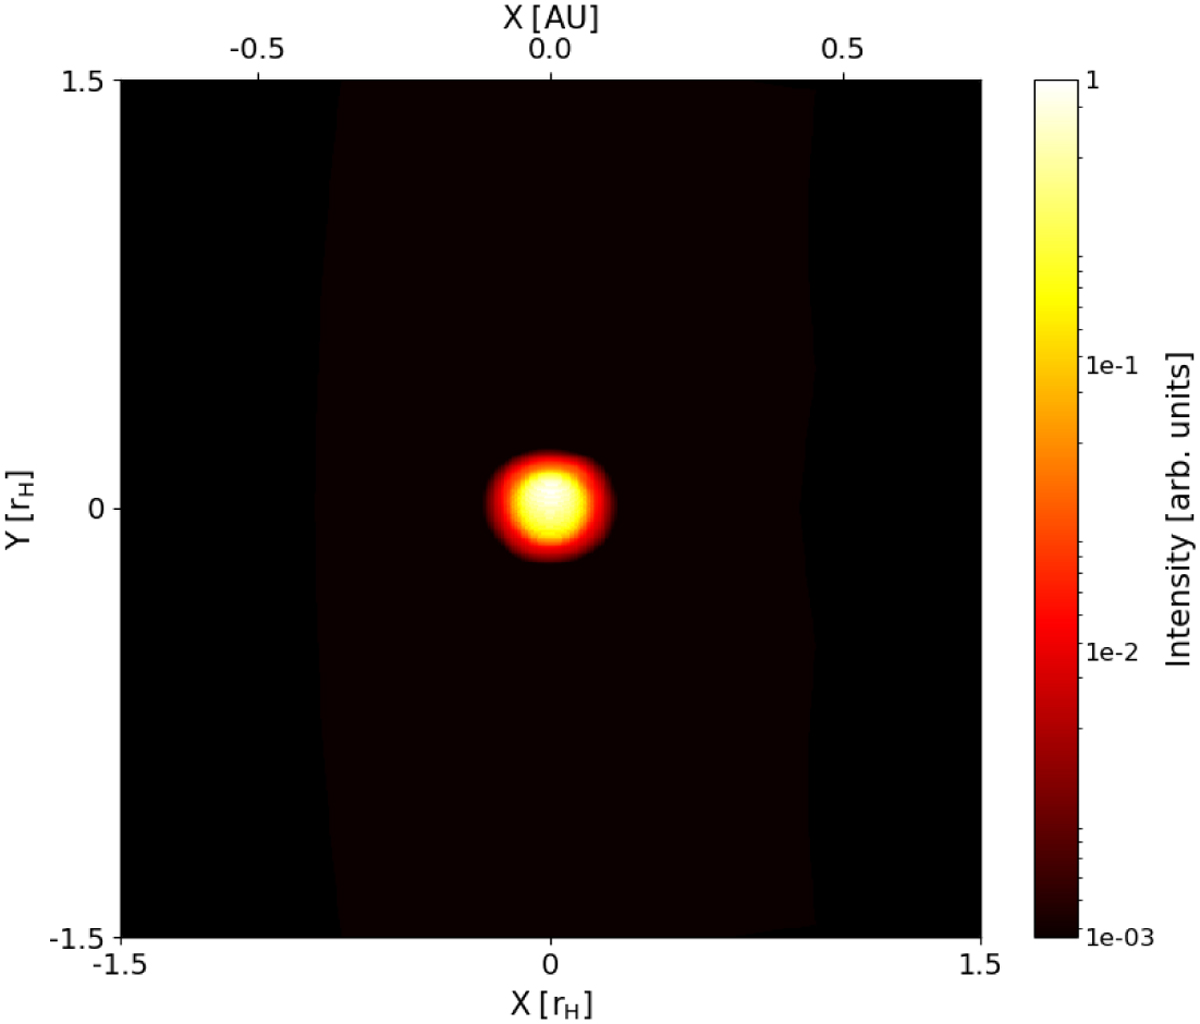
Fig. 4
Download original image
Intensity map of a synthetic observation of the planet and CPD at 5 µm. The image is as is to be expected from the computed 5 µm-emission surface in Fig. 2. The CPD is not visible, as at those wavelengths water ice and organics as opacity sources have sublimated away. This image is also representative of any simulation set-up where we find planet-dominated spectral regions, which can also happen up to the sub-millimetre. It is then usually the black-body-tail from the planetary contribution overshining the CPD signal. The latter is then weak, as the flux is Fλ ∝ κ(λ)Σ, with Σ being the surface density, and κ(λ) ∝ λ−2 in the far-infrared. Increasing the contrast to arbitrary, unrealistic levels would still make the CPD contribution visible (see text for more details).
Current usage metrics show cumulative count of Article Views (full-text article views including HTML views, PDF and ePub downloads, according to the available data) and Abstracts Views on Vision4Press platform.
Data correspond to usage on the plateform after 2015. The current usage metrics is available 48-96 hours after online publication and is updated daily on week days.
Initial download of the metrics may take a while.