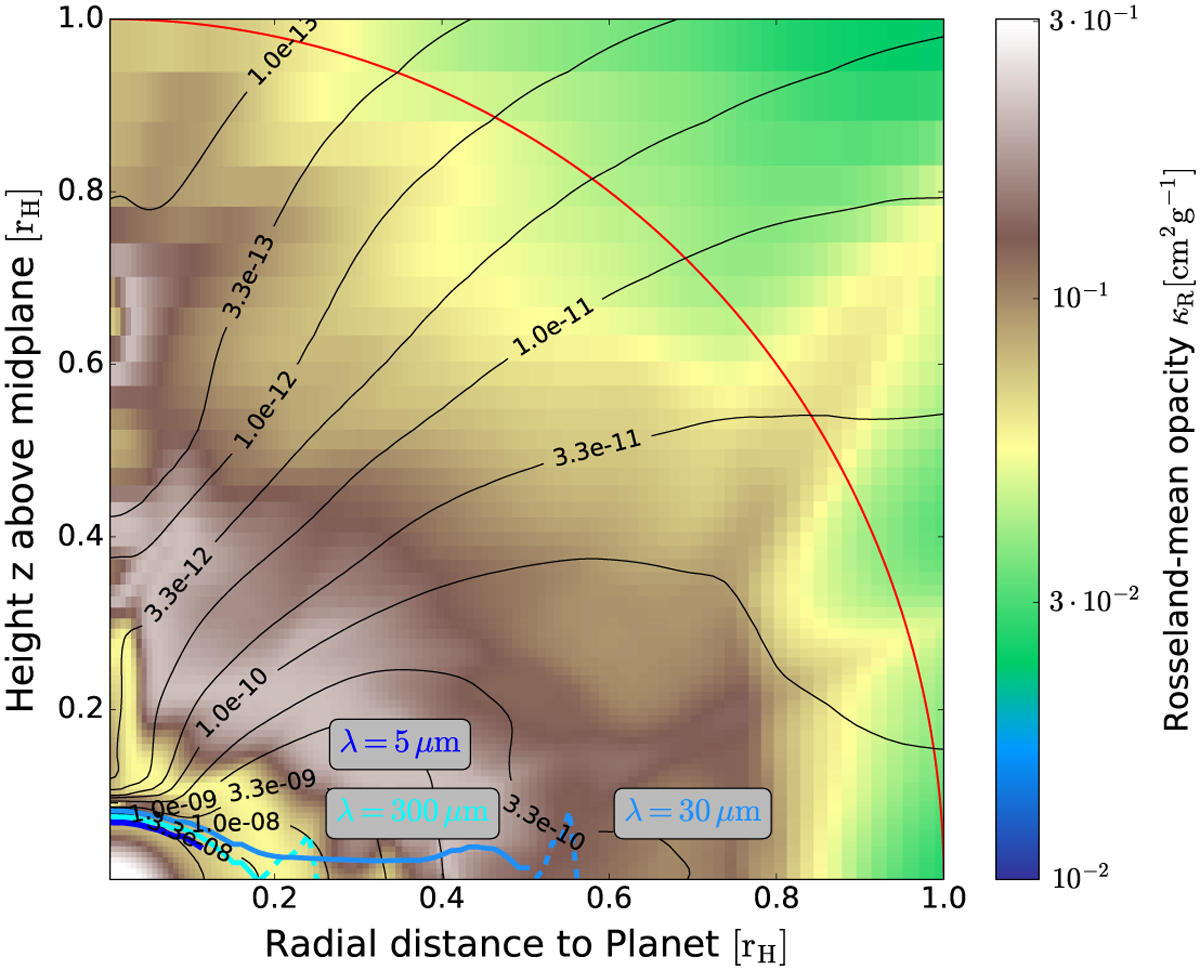
Fig. 3
Download original image
Same as Fig. 2 but for the low-opacity hydro-simulations and sim 6, which has the same optical depth as sim 1 after a ×100 density increase. Again, the background colour is the Rosseland opacity computed only with olivine and water ice to highlight compositional differences. The τ = 1 emission surfaces were again computed with the full opacity model including all species, as was used in the paper to compute spectra.
Current usage metrics show cumulative count of Article Views (full-text article views including HTML views, PDF and ePub downloads, according to the available data) and Abstracts Views on Vision4Press platform.
Data correspond to usage on the plateform after 2015. The current usage metrics is available 48-96 hours after online publication and is updated daily on week days.
Initial download of the metrics may take a while.