Fig. 9
Download original image
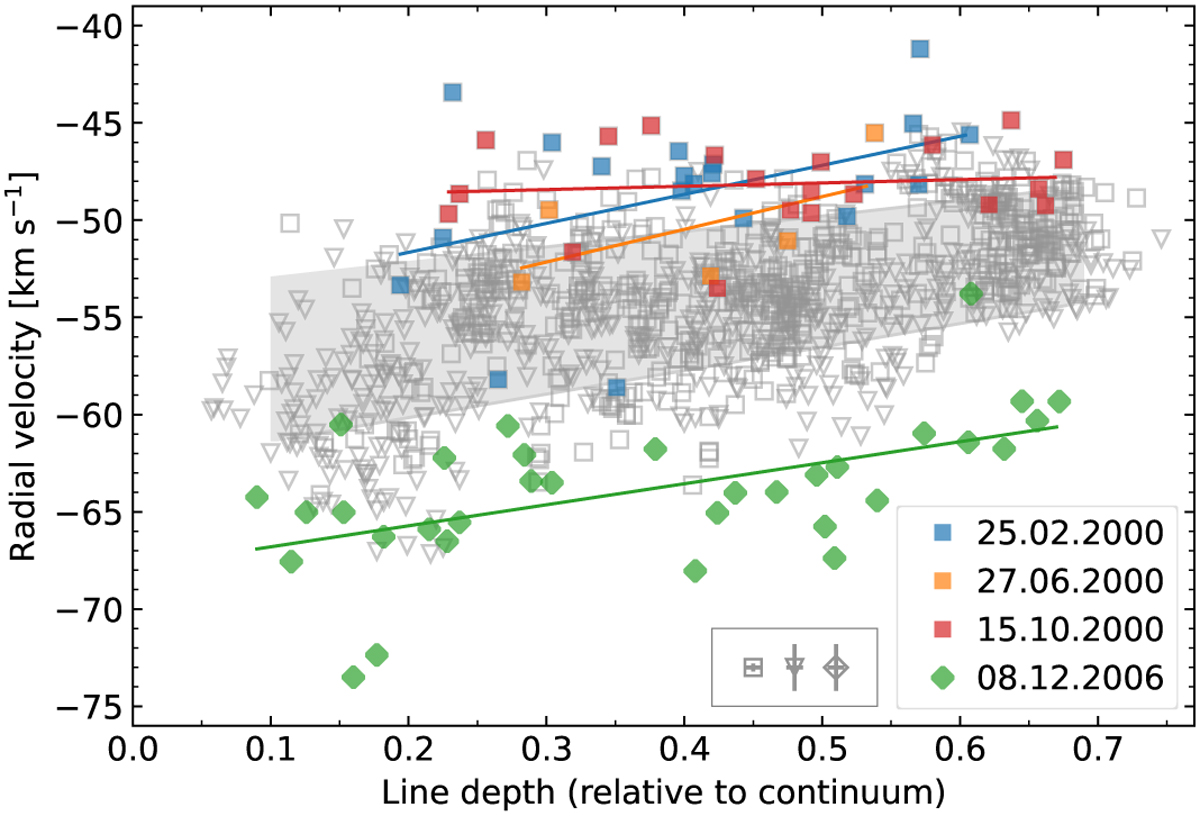
Correlation between υrad and line depth in 1999–2006. The grey area shows the standard correlation slopes. Epochs during which the correlation does not fit the standard have been highlighted in different colours. Different shapes correspond to different instruments: square is DAO, triangle is ELODIE, and diamond is ESPaDOnS.
Current usage metrics show cumulative count of Article Views (full-text article views including HTML views, PDF and ePub downloads, according to the available data) and Abstracts Views on Vision4Press platform.
Data correspond to usage on the plateform after 2015. The current usage metrics is available 48-96 hours after online publication and is updated daily on week days.
Initial download of the metrics may take a while.