Fig. 7
Download original image
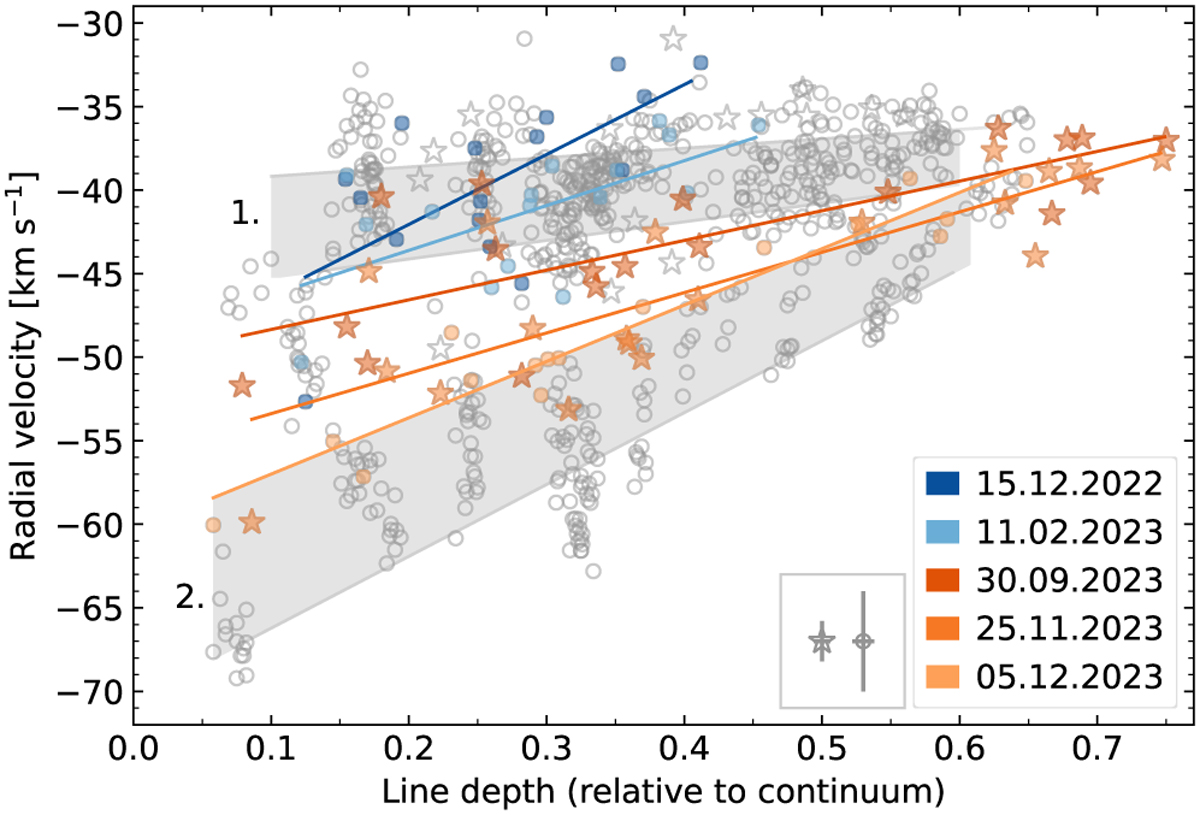
Correlation between line depth and υrad. TO data are marked with circles and FIES data with stars. The grey areas describe the correlation between υrad and line depth during two distinct time periods: Area no. 1 is for observations made between March 2023 and Aug. 2023; Area no. 2 is for spectra from Dec. 2023 onwards. Highlighted dates show different correlation behaviour. The orange-coloured dates are from the time period between those covered by the grey areas: the correlation shift from area 1 to area 2 happened within a few months in late 2023. The blue-coloured dates are from the dimming minimum, when lines were extremely shallow.
Current usage metrics show cumulative count of Article Views (full-text article views including HTML views, PDF and ePub downloads, according to the available data) and Abstracts Views on Vision4Press platform.
Data correspond to usage on the plateform after 2015. The current usage metrics is available 48-96 hours after online publication and is updated daily on week days.
Initial download of the metrics may take a while.