Fig. 5
Download original image
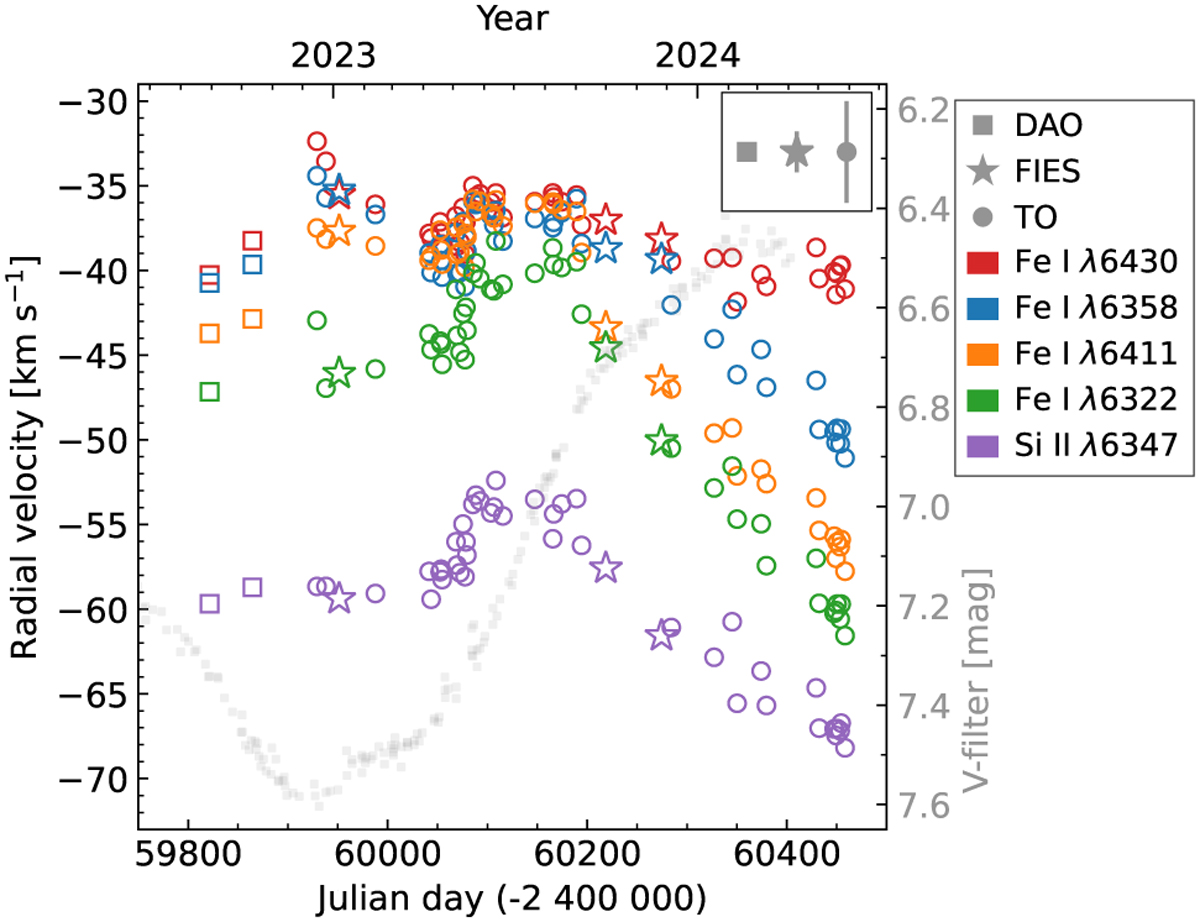
Zoom-in on the dimming period from Fig. 4 with the same spectral lines using the same labels and colours. Light grey shows the V -filter light curve for reference (y-axis on the right). All four Fe I lines achieve similar maximum radial velocities during the dimming minimum, but the post-dimming behaviour is different: some lines have returned to their normal levels (orange and green in the figure), while others (red) retain the high radial velocity for longer.
Current usage metrics show cumulative count of Article Views (full-text article views including HTML views, PDF and ePub downloads, according to the available data) and Abstracts Views on Vision4Press platform.
Data correspond to usage on the plateform after 2015. The current usage metrics is available 48-96 hours after online publication and is updated daily on week days.
Initial download of the metrics may take a while.